Playing with Data

Personal Views Expressed in Data

Which Is More Rare? The Current Tornado Drought or the 2011-2012 Tornado Surplus

Anyone who is interested in severe convective weather is probably aware of the current tornado drought. For those who are unaware, this refers to the 12-months from May 2012 through April 2013 having the fewest number of (preliminary) F/EF-1 or stronger tornado reports of any 12-month period in the official tornado record. This follows on the heels of the 12-month period of June 2010 through May 2011 as having the most number of F/EF-1 or stronger tornado reports of any 12-month period. The question I wanted to know was, how rare of an event are each of those?

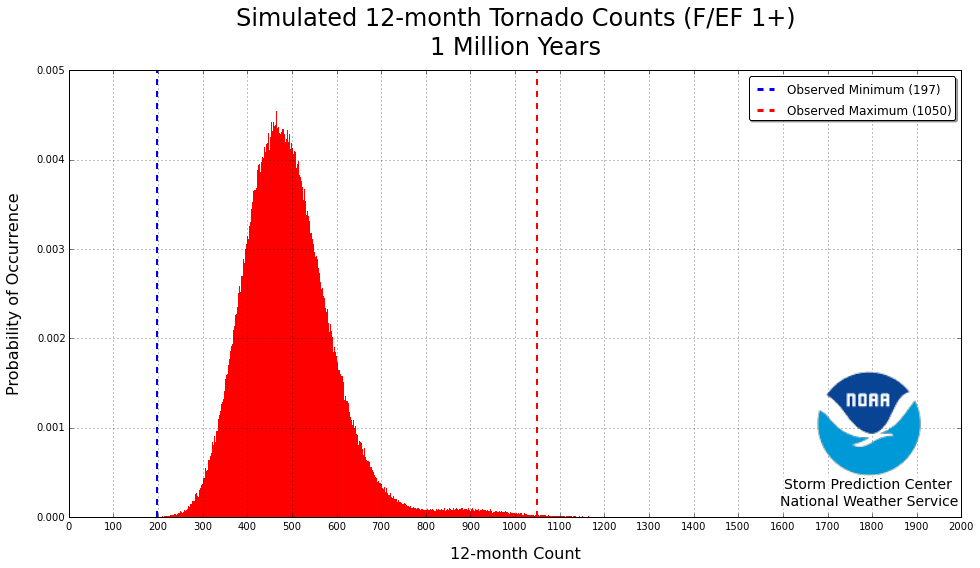
To determine the answer I conducted a little data experiment. I calculated the number of tornadoes of strength F/EF-1 or stronger that occurred in each month of the year for the years 1954 through 2012. (No 2013 data are used in the following calculations.) Thus, I had 59 January counts, 59 February counts, ..., 59 December counts. For each month I randomly selected a count from that month's distribution. I then summed each of those twelve randomly determined counts to create a randomly generated yearly count. Note, each month only contributed to the year once. I then repeated this process for a total of 1 million randomly generated yearly tornado counts. The minimum number of yearly tornadoes was 149, with 1332 the maximum. The distribution of these 1 million yearly tornado counts is shown below:

The distribution is plotted in color-filled red. Additionally, the current tornado "drought" is shown via the blue dashed line (197 F/EF-1 or stronger tornadoes) and the previous tornado "surplus" is shown via the red dashed line (1050 F/EF-1 or stronger tornadoes). Using the distribution above, we can determine the empirical probability of a given yearly tornado count.

  • Simulated Minimum (149) Probability: ~0.0
  • Observed Minimum (197) Probability: 0.000018
  • Observed Maximum (1050) Probability: 0.999141 (0.000858999999999)
  • Simulated Maximum (1332) Probability: ~1.0 (~0.0)
  • Return Period for Observed Minimum: 55555.5555556 years.
  • Return Period for Observed Maximum: 1164.1443539 years.

As you can see, both the recent drought and the recent surplus are quite anomalous. A yearly tornado drought like the current one would occur once every 55,556 years. A yearly tornado surplus like 2010-2011 would occur once every 1164 years. As you can see the current 12-month tornado drought is a much rarer occurrence.

The model above, however, is rather simple. It does not take into considerations anything along the lines of "being locked in a pattern". What I mean by this is that often times when you are in a below normal tornado month, the next month tends to be below normal as well. In other words, when the pattern gets good or bad, it tends to favor staying good or bad, at least in the short term. At the suggestion of Dr. Harold Brooks of the National Severe Storms Laboratory, I decided to update the model to see if I could include the monthly dependency.

Using the median tornado count for each month as "normal", I determined if a given month's tornado count was above/below/equal normal. I then compared to see if the following month was above/below/equal normal. It turns out that about 52% of the time, the "pattern" remains the same in subsequent months. About 41% of the time the pattern "flips" to the other extreme, and about 7% of the time the pattern either remains or transitions to "normal".

  • Number of month transitions: 707.0
  • Flip Pattern: 292 (0.413012729844)
  • Persist Pattern: 367 (0.51909476662)
  • Median: 48 (0.0678925035361)

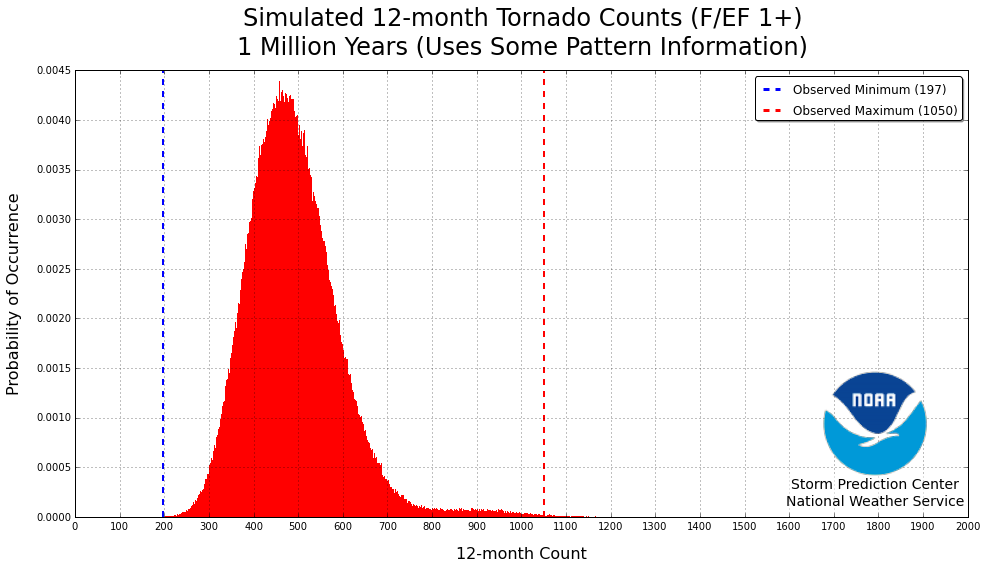
Using this information, I updated how I randomly generated the yearly counts so that subsequent month's counts were somewhat related to the current month's count. This was done by determining if the current month was above/below/equal to "normal". Then, based on the pattern change information listed above, I used a weight resampling approach to determine if the following month would be above/below/equal to "normal". If the month was "forecast" to be above normal, I randomly chose a monthly count from that month's above median counts. If the month was "forecast" to be below normal, I randomly chose a monthly count from that month's below median counts. If the month was "forecast" to be normal, I randomly chose a monthly count from that month's entire distribution. Again, this is still a simple model, but it does at least attempt to capture inter-monthly dependencies. The minimum number of yearly tornadoes in this updated model was 161, with 1325 the maximum. The updated model distribution is shown below. Although it's extremely hard to differentiate from the previous distribution is is different!

  • Simulated Minimum (161) (Probability: ~0
  • Observed Minimum (197) Probability: 0.000035
  • Observed Maximum (1050) Probability: 0.999062 (0.000937999999999)
  • Simulated Maximum (1325) Probability: ~1.0 (~0)
  • Return Period for Observed Minimum: 28571.4285714 years.
  • Return Period for Observed Maximum: 1066.09808102 years.

As you can see, both the recent drought and the recent surplus are still quite anomalous, although not nearly as much. A yearly tornado drought like the current one would occur once every 28, 571 years. A yearly tornado surplus like 2010-2011 would occur once every 1066 years. As you can see the current 12-month tornado drought is still a much rarer occurrence.

Anyway you look at it, the recent tornado "surplus" and the current tornado "drought" is extremely rare. The fact that we had both of them in the span of a few years is even more so!
Acknowledgements

Below is the acknowledgements section of my dissertation...which is scheduled to be deposited tomorrow afternoon at 1PM. The journey is coming to a close...


``We are like dwarfs sitting on the shoulders of giants. We see more, and things that are more distant, than they did, not because our sight is superior or because we are taller than they, but because they raise us up, and by their great stature add to ours.''

--- John of Salisbury, Metalogicon (1159)

You do not simply write a dissertation overnight. It takes many years, or in my case, a lifetime, of people pouring themselves into you. People who give selflessly of their time and energy to ensure that you achieve your goal(s). So when it comes time to finish that endeavor, how do you recognize everyone that has played a role in helping you get to the point of writing a dissertation? How can a few typed words convey the lifetime of appreciation and thanks that everyone so rightly deserves? I know that words can never fully convey the appreciation I have for everyone who has helped me along my journey, but I offer them up as an attempt.

First and foremost I must thank my main advisor, Dr. John (Jack) Kain for taking a chance on a graduate student he barely knew. Without his willingness to rescue me from myself, I would not be writing a dissertation, nor would I be currently employed at the Storm Prediction Center. Furthermore without his guidance and patience, and not to mention willingness to let me explore scientific endeavors not directly related to my dissertation research, I would not be poised on the threshold of entering the community of scholars. I am forever indebted to him. Along the same lines, thanks must be given to my co-advisor, Dr. Kevin Kloesel, for his willingness to serve on and chair my dissertation committee. Additionally, it was the many meetings, particularly the off-site and unorthodox meetings at various baseball stadiums, that gave me just enough of a distraction to keep me (somewhat) sane. Lastly, thanks must be given to my dissertation committee for their guidance and insights they offered me. In particular, the guidance offered by Drs. Michael Richman and S. Lakshmivarahan went above and beyond what could reasonably be expected of a dissertation committee.

As I alluded to previously, I would not be finishing this dissertation if I had not been rescued from myself. In addition to Dr. Kain, Drs. Michael Coniglio, David Stensrud, Harold Brooks, and Louis Wicker all played a role in creating a graduate student position for me at the National Severe Storms Laboratory. More importantly, these scholars convinced me to undertake a dissertation project about which I was passionate, even if it was without (initially) stable funding, rather than stay in my comfort zone and pursue a dissertation project that had funding, but about which I was only tangentially interested. It is only with the knowledge and hindsight that comes with being on the completion side of a dissertation that I realize how difficult, if not impossible, it would be to complete a dissertation on a topic about which I was less than completely passionate.

A dissertation in meteorology typically begins in childhood, when one begins to notice the beauty and power of our atmosphere. This was certainly the case for me. I was fortunate to have been blessed by many in my life who encouraged my pursuit of knowledge of the atmosphere. I must thank Mr. Jay Hilgartner, Mr. Austen Onek, Mr. Ken Rank, and Mr. Garrett Lewis for encouraging me as a child to pursue meteorology; not to mention the countless hours each spent answering my questions. Thanks are owed to the National Weather Service Forecast Office in Tulsa, Oklahoma for their continual indulgence of a wide-eyed youth from Fort Smith, Arkansas. In particular, the willingness of Mr. Lans Rothfusz to give a father and son an impromptu private tour of the Tulsa forecast office on a Saturday afternoon and the friendship and counsel afforded me by Mr. Steven Piltz can never be repaid.

As is typically the case with most in life, my journey has been profoundly shaped by many educators along the way. Thank you to Ms. Robin Bryan, Mr. James Moody, Mr. Charles Besancon, Mr. Larry Jones, and Dr. Barry Owen for their encouragement through my secondary education. Thanks and gratitude must also be offered to Drs. John and Gay Stewart, my undergraduate advisors, for refusing the let me give up and for helping me reach my potential.

Friendships are important in completing a dissertation and I offer thanks to all of my friends for their friendship, of which there are too many to enumerate here. Without your friendships I never would have remained grounded and focused on finishing my dissertation. The friendships of three individuals in particular are most crucial in setting me on the path that has culminated with this dissertation: Mr. David Whiteis, Mr. Wayne Johnson, and Mr. Forrest Johns. I met Mr. Whiteis at a SKYWARN Spotter training class in the spring of 1997. The spotter class was cut short due to severe convective weather, and Mr. Whiteis offered to take me to the Fort Smith Airport to meet the local SKYWARN Spotter Network Controller, Mr. Johnson, and the local National Weather Service meteorologist, Mr. Johns. In hindsight I often wonder what my parents were thinking to let met take a ride with a stranger to an airport to meet a bunch of other adults. But if not for this occurrence I would have delayed, or missed out entirely on, meeting three of most influential people in my life. Mr. Johnson, Mr. Whiteis, and Mr. Johns treated me like a son. They nurtured my passion for severe convective weather and helped keep me on a solid foundation through my formative teenage years when I was ``too smart'' to listen to my parents. All I can offer these three is my thanks and a promise to pay it forward.

For those unaware, hobbies that stem from science are often expensive. I am very grateful to my family, especially my parents, Mr. Thomas Marsh and Mrs. Letitia Marsh, for their sacrifices in order to encourage my interest in the atmosphere; my passion for meteorology would have easily been extinguished if not for them. For the many trips to the local television station to meet with Mr. Hilgartner and Mr. Onek, to the willingness to take me storm chasing to observe the atmosphere first hand, to the purchasing me countless weather instruments and books, to the plastic weather station we installed in the backyard, I cannot thank you enough. This dissertation is as much a testament to your sacrifices, love and encouragement as it is a testament of my perseverance and work ethic --- which I learned by watching you when you did not notice. Thank you to my brothers and sisters , aunts, uncles, and grandparents for putting up with my incessant need to talk about the weather, and all the wonderful weather gifts they have given me through the years.

Thanks must be given to my wife's family and her extended family. Their patience with me as I completed graduate school, their prayers, and their affirmation helped sustain me through the difficult times.

And lastly, I must offer my most heartfelt and sincerest thanks to my loving wife, Sarah. Without her love, patience, and support the dream of finishing my dissertation would have died a long time ago. Thank you for all you did these past years, most of which I am sure I failed to recognize and appreciate. Words can never express how much I love you.

A Fork in the Road

Another turning point, a fork stuck in the road
Time grabs you by the wrist, directs you where to go
So make the best of this test, and don't ask why
It's not a question, but a lesson learned in time
It's something unpredictable, but in the end is right,
I hope you had the time of your life.

---- Green Day's "Good Riddance"

Today I accepted a "Techniques Development Meteorologist" position with the Storm Prediction Center in Norman, Oklahoma. For all practical purposes this is an ideal job for someone like me. I get to develop cool stuff for use in Storm Prediction Center operations, I get to play around with data (!), and I'll occasionally get to work forecast shifts alongside some of the best meteorologists in the world. As you can imagine, I'm pretty excited right now. As excited as I am, I still like to remember how I got to where I am. In some ways this keeps me grounded in reality, or as close to reality as my life seems to allow. I'll spare you the stories of all the people who took me under their wing and invested in me. But in full disclosure it is these people --- and I hope they know who they are --- and their investments that have put me on the course I travel. Without them, each and every single one of them, who knows where I would be.

Instead, I want to tell the story of a fateful day back in May of 2009. I was downstairs in the National Weather Center having lunch when my current advisor came in. He had previously left the University and so our communications were fairly limited. This is important because I had not told him that I had agreed to work on the VORTEX2 project in the VORTEX2 Operations Center. See, my research at the time was on climate and climate change related things and not directly tied to a field experiment dedicated to observing and documenting tornadoes. My advisor at the time was paying me out of his own research funds, not through a dedicated grant, and if I wasn't helping and advancing his research needs he was essentially losing money on the deal. As such he informed me that he could not justify funding me for the summer if I was going to work with VORTEX2, and not on the project(s) I was supposed to --- which is totally understandable.

I felt I could not back out of working with VORTEX2 as the project started in days, and so I thought I would be without funding for the summer. Fortunately for me, Lou Wicker (NSSL) and Mike Biggerstaff (OU) came through and found money in their grants to fund me for the summer. This allowed me to work on VORTEX2 and still be able to pay the bills. At the end of the summer I had to decide what I wanted to do. I could either chart a new course for my dissertation or return to working with my old advisor and promise to give up the other activities. Since I had not found any funding other funding, I felt I had to go back and work for my old advisor on topics that only interested me in passing, which was less than idea for both of us. Shortly before I was to have my decision to my old advisor, Jack Kain (NSSL), whom I had only met in passing, suggested that before I agree to go back that I first have a meeting with some people from NSSL and discuss with them some ways forward. He felt that if I wasn't passionate about what I was doing that I would not finish. I agreed to have this meeting.

This meeting consisted of Mike Coniglio (NSSL), Lou Wicker, Harold Brooks (NSSL), and Jack Kain. (There may have been others, and if I left someone out, I sincerely apologize!) At this meeting it was decided that I should spend the fall trying to figure out what I wanted to do and to secure funding for that project. In the meantime, Harold had some money set aside for emergencies and was willing to fund me for the semester.

When December rolled around I still had not found a project I was interested in that had funding. I was running out of options and had no idea what was going to happen. It was mid-month that I was told that Jack Kain, whom I still only knew in passing, had been working with Mike Coniglio and David Stensrud (NSSL) to create a Liaison position for the Hazardous Weather Testbed. They thought that I had a skill set that would be very valuable for the HWT and since I spent all my time in their anyways, by tying the two together I might actually be motivated to finish my PhD. The funding for this position came through in early January --- ironically it was held up for a few weeks as the result of continuing resolution budget issues --- and the rest is sort of history.

Later I asked Jack why he was willing to work so hard for someone he didn't really know and had no real ties to. He told me that he was impressed with my passion for working with the operational community and had generally heard good things about what I was capable of. He didn't want someone he believed could do good things to fall through the cracks if he could do something to help. He also pointed out that it wasn't just him, that it was actually a collection of people who were willing to take a chance on me and that I should be very thankful --- which I am.

On this side of things I can look back and recognize that day in May of 2009 as a huge fork in the road of my life. If my former advisor had not pulled my funding --- something he had every right to do and ultimately had a responsiblity to do!!! --- I most likely am not accepting the position with the Storm Prediction Center today. For you see, the opportunity I have today is a direct result of the skills I developed in the HWT over the last 3 years.

Life is full of these painful moments that seem unfair and don't make any sense at the time. Times in which you have to make painful choices, to take chances, and you never know if you made the right decision. It's times like these I think back to the advice of my departed Grandfather. "No matter what decision you make, after you make one, it becomes the right one." The advice here: Don't look back; Don't second guess; Don't fall into the what-if trap.

You never know the opportunities that await you...until you get there.

Population Affected by Tornadoes and Tornado Warnings

I have been curious as to the number of people warned for tornado warnings during the Storm Based Warning Era for awhile. Today I needed a mental break from my dissertation so I spent 20 minutes and calculated the numbers. Then, as it typically happens, I started to ask additional questions, such as "What's the number of people impacted?" I decided to do that as well. Below are the results.

To compute the total population that was warned, I took each warning, gridded it on to the 5-km population grid I have, and then counted the number of people inside that polygon. The population grid is taken from the 2010 census, so the number of people warned is an approximation and is also normalized to 2010 numbers. To calculate the number of people impacted, I gridded each tornado track, using the data from the Storm Prediction Center's WCM Data Page, onto the population grid. This resulted in a tornado track that was 5-km wide. Assuming a tornado width of 1km (which is a large tornado!) this gives me the number of people who were approximately within 2-km of the tornado track. I repeated the process with 3 grid point line-width (+/- 7-km) and with a 5 grid point line width (+/- 12-km). I then summed the population totals for each of these scenarios. Lastly, I calculated the percentage of people warned that were impacted for each of the radii thresholds (+/- 2-km, +/- 7-km, +/- 12-km). This is presented in the tables below as the percentage in parentheses.

CAVEATS

Please note these are approximations. The population counts are based on census data and are only as good as the census data. It does not account for transients (i.e., people who were just passing through the area). Furthermore, if an area was warned twice, those people were counted twice. The number of people warned (presented here) is not the same as the number of unique people warned.

One last, important caveat. A tornado that occurred, but was not warned, will still count toward the population impacted. The population impacted by tornadoes is exactly what it says it is. It is not a conditional count requiring a warning to have been issued.

In any event, here's the results. I'm interested in what you guys think. Feel free to leave suggestions as well, but just know that I'm headed back to working on my dissertation so it might be a week or so before I can act on any of these suggestions!

Number of People Warned For
Tornado Warnings

  • 2008: 134,180,576
  • 2009: 99,676,144
  • 2010: 133,951,616
  • 2011: 144,896,400
  • 2012: 90,455,328

Number of People Impacted By
Tornadoes (+/- 2 kilometers)

  • 2008: 5,772,576 (4.3 %)
  • 2009: 3,120,432 (3.1 %)
  • 2010: 4,935,376 (3.6 %)
  • 2011: 7,068,976 (4.8 %)
  • 2012: Official Tornado Data Unavailable At This Time

Number of People Impacted By
Tornadoes (+/- 7 kilometers)

  • 2008: 15,949,392 (11.8 %)
  • 2009: 8,370,304 (8.3 %)
  • 2010: 15,872,896 (11.8 %)
  • 2011: 22,155,984 (15.2 %)
  • 2012: Official Tornado Data Unavailable At This Time

Number of People Impacted By
Tornadoes (+/- 12 kilometers)

  • 2008: 23,074,960 (17.2 %)
  • 2009: 12,152,944 (12.2 %)
  • 2010: 22,187,520 (16.5 %)
  • 2011: 33,982,416 (23.5 %)
  • 2012: Official Tornado Data Unavailable At This Time

Radar Animation of a Heavy Snow Band

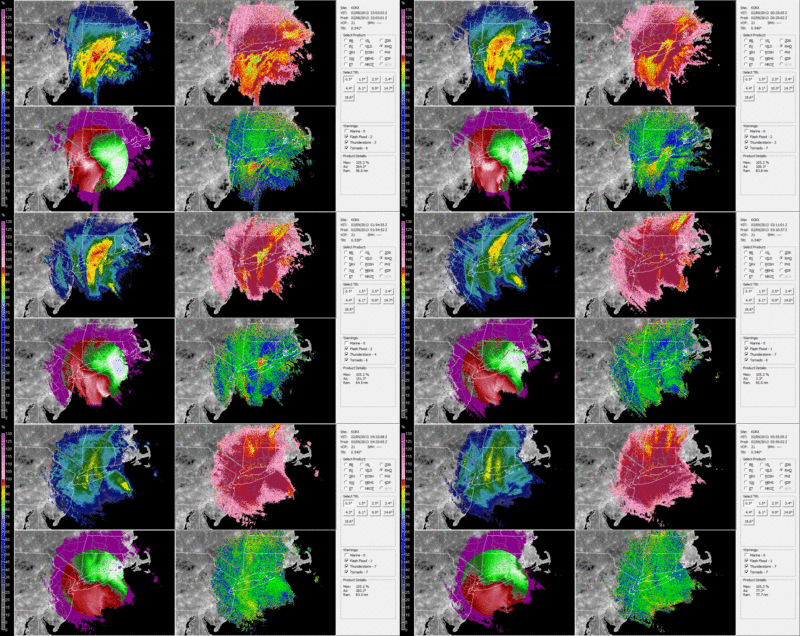
Anyone who looked at radar animation of this past weekend's nor'easter would have quickly noticed an intense precipitation band that stretched from Long Island northward into Connecticut. This band, at times, had dBZ values that were higher than 55 dBZ, and predominantly produced snow. (There are some reports that in southern Connecticut sleet or maybe small hail were also reported.) Beneath this band snowfall accumulations were upwards of 6" per hour!

For those who did not witness this band in person, I have put together an animated gif depicting the evolution of this band. The animation begins near 23 UTC on 08 Feburary 2013 and ends 06 UTC on 09 Feburary 2013. The four panels are:

  • Upper Left: Lowest Tilt Base Reflectivity
  • Upper Right: Lowest Tilt Correlation Coefficient
  • Lower Left: Lowest Tilt Base Velocity
  • Lower Right: Lowest Tilt ZDR

You may recognize the background. It's the black and white version of the GRx Population Backgrounds, which were announced in this post.

For a larger image animation, click on the image above to get the full resolution. Warning, it's about a 22MB animation!