Playing with Data

Personal Views Expressed in Data

Radar Analysis of a (Possible) Developing Tornado

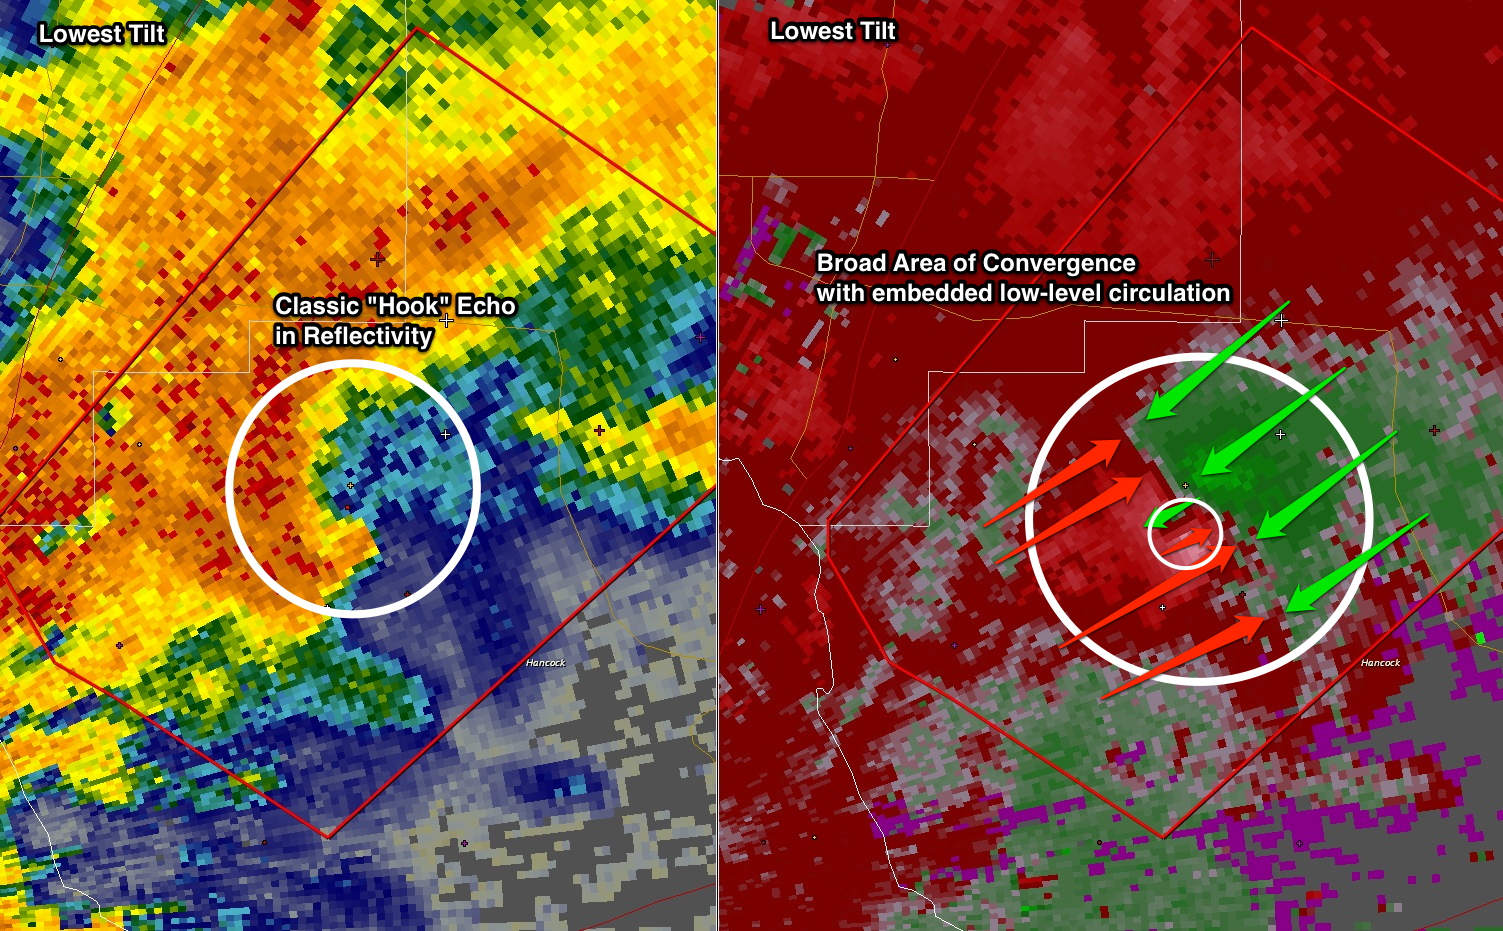
This afternoon a thunderstorm over southern Mississippi underwent an evolution that is often associated with tornado occurrence in thunderstorms. Whether or not a tornado developed remains to be seen, but the radar evolution was fairly classic. What do I mean?

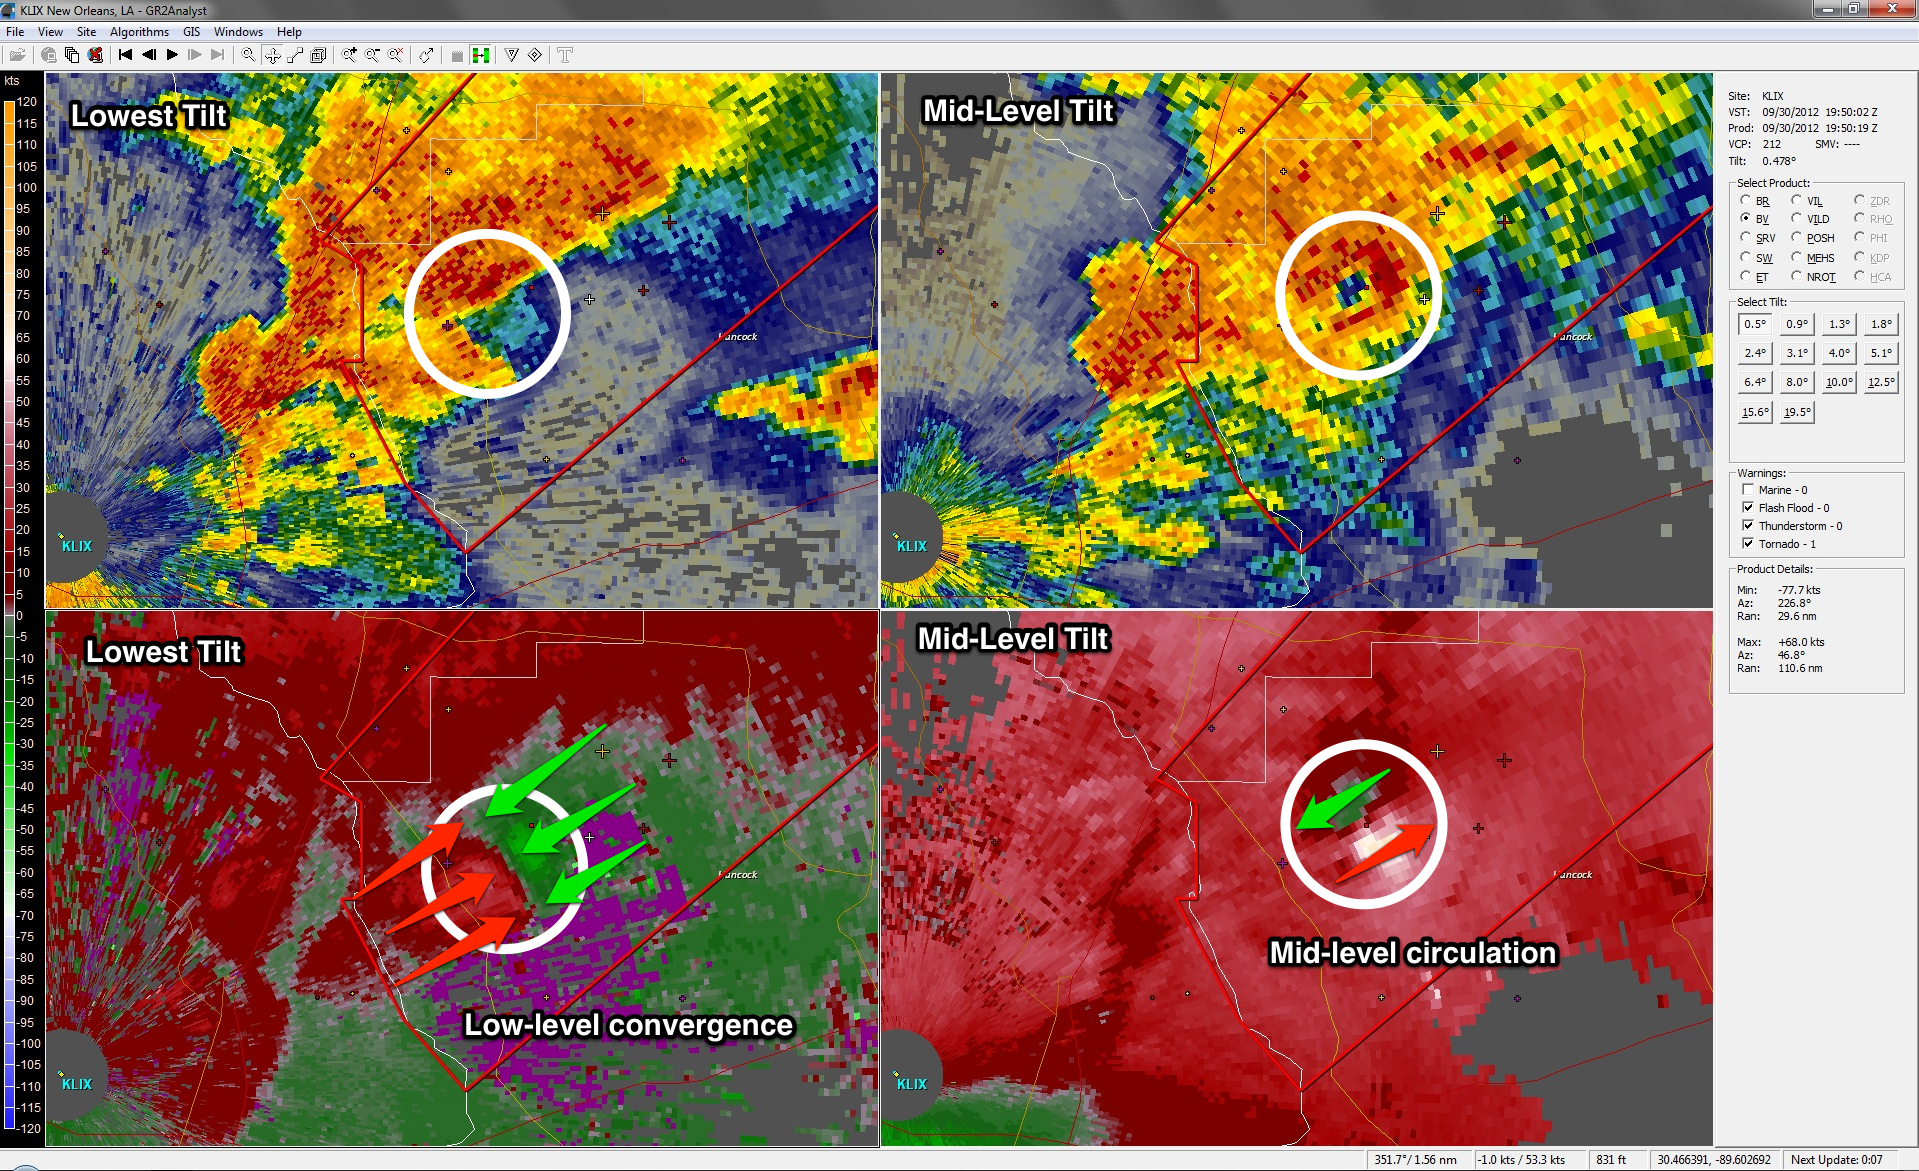
Consider the image above. The left panels are from the radar’s lowest tilt and the panels on the right are from a mid-level tilt. The top panels are radar reflectivity (which is what you typically see on television) and the bottom panels are of the doppler velocity (i.e., the wind speed and direction in a radial sense [towards or away from the radar]). [For orientation purposes, the radar site is located in the bottom left of the image, green values (in the velocity panels) are toward the radar, and red values (in the velocity panels) are away from the radar.] The mid-level pattern is similar to what one might conceptually think about with respect to identifying possible tornadoes on radar, meaning that a rotation signature is present. However, examining the lower-level tilts, we fail to find a rotational signature. Does this mean there is no tornado? Well, not-exactly…

Before continuing, let’s remind ourselves that a tornado is an extension of a thunderstorm’s updraft. By definition, an updraft is a area where air is ascending. Furthermore, the mass continuity equation dictates that if air is rising, there must be convergence at the base of the updraft. This means that in the presence of a developing tornado, you may not find a rotational couplet; instead you might find a convergent signature, which is exactly what we see in the radar image above.

In the next radar scan (shown below), as the (possible) tornado continues to develop (and move farther away from the radar site), we notice that the broad, low-level convergence still persists. However, in this scan, one can notice the addition of a rotational couplet in the midst of the broad low-level convergence. If one were to continue to follow the evolution of this (possible) tornado, one would find that the low-level rotation signature persists for several more volume scans…all in the vicinity of the broader, low-level convergence.

So, what does this mean? When looking at radar data, it is important to examine the entire radar volume — not just the lowest tilts! Thunderstorms are very complex. What happens at low-levels typically plays a role in what happens in the upper-levels, and what happens in the upper-levels impacts what happens in the lower-levels.

Understanding Tornado Risk

It’s been a while since I’ve written on the blog. First there was the 2012 Hazardous Weather Testbed Spring Forecast Experiment in May and June. Next. I was an invited participant at the 2012 European Severe Storms Laboratory Forecast Testbed in mid June. To end June I spent 2 weeks as a forecaster/nowcaster in Salina, KS for the DC3 Field Experiment. In July I went to the 2012 SciPY Conference, and in August I deployed with the OU SMART-Rs to collect data on the landfall of hurricane Isaac. As you can see, there wasn’t much time left for blogging.

Anyways, I’m pretty sure you aren’t here to read about why I haven’t posted.

For reasons too numerous to list here, I have been interested in understanding risks associated with high-impact weather. One particular interest of late is the debate between weather enthusiasts regarding the risk posed by tornadoes in the plains to the risk posed by tornadoes in the southeast United States. Typical arguments of risk revolve around who has the greatest number of tornadoes, which would seem relatively unambiguous. However, because of the relative rarity of tornadoes, even this is rife with controversy. Additionally, people tend to associate tornado risk/exposure based upon the ill-defined “tornado season” of the even more nebulous “Tornado Alley”.

Previously, Dr. Harold Brooks of the National Severe Storms Laboratory, put together time series of the annual cycles of tornado, wind, and hail probability. These time series were constructed using data from 1980-1999 and provided insight into the yearly cycle of severe convective hazards at individual locations. This allowed for assessing the risk/exposure to various convective hazards based on the actual climatology of a given area, rather than relying on the gross statistics of “Tornado Alley”. Unfortunately, Dr. Brooks’ data had not been updated to account for the additional decade of tornado data and thus was removed from the NSSL website. Updating this information has long been on my wish list; this week I decided to cross it off my wish list.

(Note: Dr. Brooks has since informed me that the data were removed, not because they had not been updated, but because the software broke.)

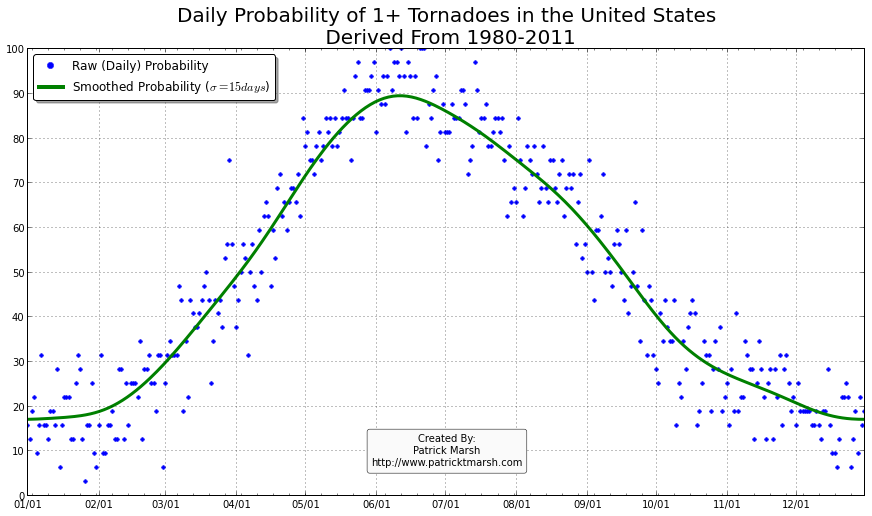
The annual cycle of at least one tornado occurring the United States shows a pronounced peak in the summer months. It is my guess that “tornado season” refers to this significant uptick in US tornado probabilities, meaning we can define “tornado season” as the time period of relatively enhanced tornado probabilities. I suspect that a vast majority of people throughout the United States assume that their individual risk follows a somewhat similar distribution, albeit with smaller probabilities. Unfortunately, this is not the case. Here are the annual cycles of the probability of a tornado developing within 25 miles of a point for a smattering of locations throughout the United States that all have roughly the same overall tornado exposure:

Plains Locations

Southeast Locations

As you can see, not every location has a single peak probability in the late spring into early summer. So called “tornado season” varies from location to location, even though the yearly risk/exposure (area under the green curve) are similar. The annual cycles are sorted into two groups to illustrate that the annual cycles for locations in the plains are different from those in the southeast. In the plains, the annual cycles have one predominant peak probability (which roughly corresponds with the US peak probability), indicating a well-defined “tornado season”. In the southeast there are multiple peaks — albeit each one smaller than those seen in the plains — but the off-peak probabilities are typically greater than the off-peak probabilities in the plains.

So what does this all mean? One’s climatological exposure to tornadoes is geographically-dependent. Another way to say this: “Tornado season” in the southeast US is fundamentally different than “tornado season” in the plains. Persons located in the plains have a greater risk of a tornado developing within 25 miles of their location in the spring than they do any other time of the year. Persons located in the southeast have a relative small increase in probability in the spring/summer, but must be on guard all year as the climatological probability of a tornado never really approaches 0.

Update 2: Here is a video of the daily probabilities for the entire US. Please note that the standard resolution video is a bit degraded. For more clarity, please switch to the HD version.

NWS Verification: A Lesson in Gaming the System

As I write this quick post, a strong bow-echo is racing across northern Minnesota and northern Wisconsin. The National Weather Service Forecast Office in Duluth, MN issued several large warnings (3rd largest NWS warning and 9th largest NWS warning) for the areas along and ahead of the approaching bow echo. I’ll leave the debate over whether issuing such large warnings are good for service to a later date.

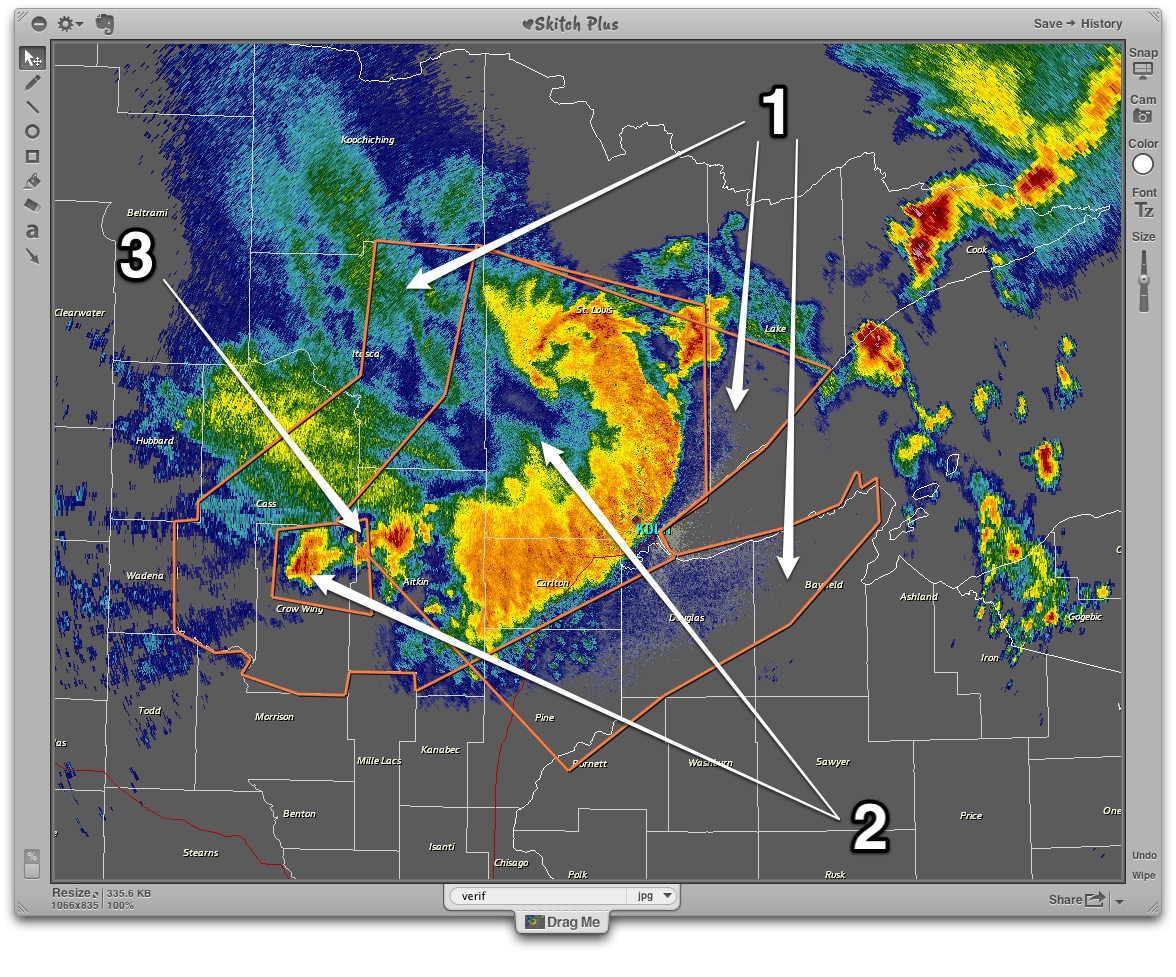
Instead, I want to take a quick moment to highlight what I perceive to be a deficiency in how the NWS does it’s verification. This deficiency actually rewards forecasters for issuing larger warnings, such as those issued tonight by NWS Duluth. Consider the three warnings below, all which were valid at the same time.

First, let’s assume that a severe weather report occurs in the domain shown at the time this image was taken. Next, let’s assume that a severe weather report occurs at any of the areas denoted with a “1″. In this case the single storm report verifies the single warning that contains the report. However, if a severe weather report occurs at any of the areas denoted with a “2″, that single report verifies both warnings that contain the report. Thus, a single report verifies two warnings! Now, consider the scenario in which a single severe weather report occurrs at location identified with a “3″. In this case, the single report would verify all three warnings that contains that single report!

So, what does this mean? The larger a warning, the more area in which a report can occur to verify the entire warning. Furthermore, if warnings overlap each other, a single report can verify multiple warnings. Thus, in terms of determining the NWS’s/office’s/forecaster’s verification scores, each are actually rewarded for engaging in this practice. Now, I’m not a NWS forecaster, nor have I ever been. I cannot say (and highly doubt) that gaming the verification system is consciously thought of in the heat of the warning process. However, it highlights what I consider a short-coming of the NWS’ verification process; one that rewards larger warnings in a time in which storm-based warnings were designed to promote smaller warnings.

Comments on "Attempts at Assessing Chaser Contributions to the Warning Process"

If you’ve visited this website in the past week, chances are you were here to read and/or comment on the blog post Attempts at Assessing Chaser Contributions to the Warning Process. Wow. Talk about a passionate response — on all sides! That entry has prompted the biggest response, in terms of comments, in quite some time. I have read every comment posted, but am too busy preparing for the Hazardous Weather Testbed’s Experimental Forecast Program to post a long response to every one. Instead I thought I would act as my own ombudsman and address some of the reoccurring themes that keep appearing in the aforementioned post’s comments.

When reading below, one may ask themselves why I haven’t removed the offending post. The reason is multi-faceted. First, as soon as I do that I subject myself to (in my opinion) a more severe criticism of writing somewhat of a hit piece and then taking it down when I didn’t like the response. I personally do not think that is right and so in that regard, the post must stay. If I’m going to write something that I know is going to be controversial, I must be prepared to accept the negative comments that result. My philosophy is that as long as a comment is not spam, not profane, nor attacking myself or others personally, I’ll never remove it. No matter how much I may disagree, it is only in hearing all sides of an issue that I can expand my horizons. Secondly, there have been some good discussions that have resulted from the post, both for my position and against it. As long as these conversations refrain from snarks, I see no reason why they should not be allowed to be seen.

Now, for my thoughts on the post…

Let me begin by saying that this certainly was not my best post in terms of scientific content. I made a fundamental flaw in the post that quite a few commenters picked up on, and I’ll admit that I did it. No matter what these data presented suggest, they cannot prove one way or another the intention of a person. At best, with better data than presented, one might be able to assess chaser impact, but not motives. I tried to be cognizant of this fact in some aspects of the blog post (such as not titling the post some variant on “Are Chasers Chasing to Save Lives”), but failed miserably in others (using the data shown to justify the line “Please don’t insult my intelligence by claiming to chase to ‘save lives’.”). This is something I must make sure I do not do again, and if I do, I trust you will hold me accountable.

Next, some commenters accused me of doing “bad science”. In response to at least one of these comments I responded that I never claimed to be doing science. However, after a couple days of thinking about this issue I believe that the original comment and my response both miss the point. This isn’t “bad science”, nor is it “not science”. It’s “unfinished science”. If I left things as is, said that the matter was closed, and closed my mind to differing points of view, then it most certainly would be “bad science”. Instead, I tried to go out of my way to imply that my view points were far from definitive. I wrote things such as “circumstantial evidence”, “Attempts at Assessing”, and “To summarize, I believe…”. I posted these ideas on a blog website, not a scientific journal for a reason, they are initial ideas and certainly would not hold up in a court of law nor a scientific journal.

What the post tried to do, and admittedly failed miserably at doing, was attempt to objectively assess the contributions chasers have to the warning process. I put forth an idea, people attacked it and poked holes in it. If I am to act like the scientist I would like to think I am, I should not take these criticisms personally, but rather use them to continue to evaluate my idea(s), refine the idea(s), and try again. This is how science is supposed to work! At the end of the process the final idea(s) will be stronger and more refined than anything initially proposed.

Assessing chaser impact on the warning process is an extremely complex problem as there are many variables and many signals. As several commenters suggest, I did allow myself to fall into the “confirmation bias” trap — I saw what I wanted from irrelevant and/or inconclusive data. But, by putting my thoughts out in the open, people were quick to point out the idea’s flaws, which will allow me (in time) to do better analyses with differing datasets and strengthen my position. Again, this is how I believe science should work. Putting this data and ideas on the website wasn’t the mistake, but intertwining my personal opinions so strongly was. And for that, I do have regrets; I’ll be better about that moving forward.

However, removing my personal beliefs, this is the first attempt, to my knowledge, that tries to objectively assess the contributions chasers have on the warning process. Due to the complex nature of the problem, and the fact I did this as sort of a “back-of-the-envelope” calculation, I merely looked at aggregate measures using simple NWS performance metrics. Possible ideas that could be done were suggested in the comments, and when I have time, I’ll certainly try and investigate some of these. (Aside, if a reader would like to do this, I’m more than happy to share my datasets.) There are a lot of other potential impacts, both negative and positive, that need to be assessed as well. As it stands now, a lot of anecdotal stories are offered by those on either side of this issue, but do we really have any idea what the actual impact is? From a chaser point of view, being able to demonstrate a positive impact in the warning process could help counter the negative perceptions current circulating in several news outlets and improve interactions with emergency response officials. From an emergency response official perspective, knowing chaser impacts might lead to a new respect for chasers, or more clout in trying to regulate them. But then again, maybe both sides would rather not know…

None of the comments have changed my underlying assumptions that most chasers chase for personal reasons, not the noble reasons of saving lives and doing it for the NWS often offered by chasers when interviewed by the media. However, we are (I am?) a long ways off from being able to assess this objectively. My previous post was a first attempt at this. I’m sure it won’t be my last. And I’m sure that there will always be someone out there challenging my views. That’s the way it is supposed to be.
Tornado Warning Seminar

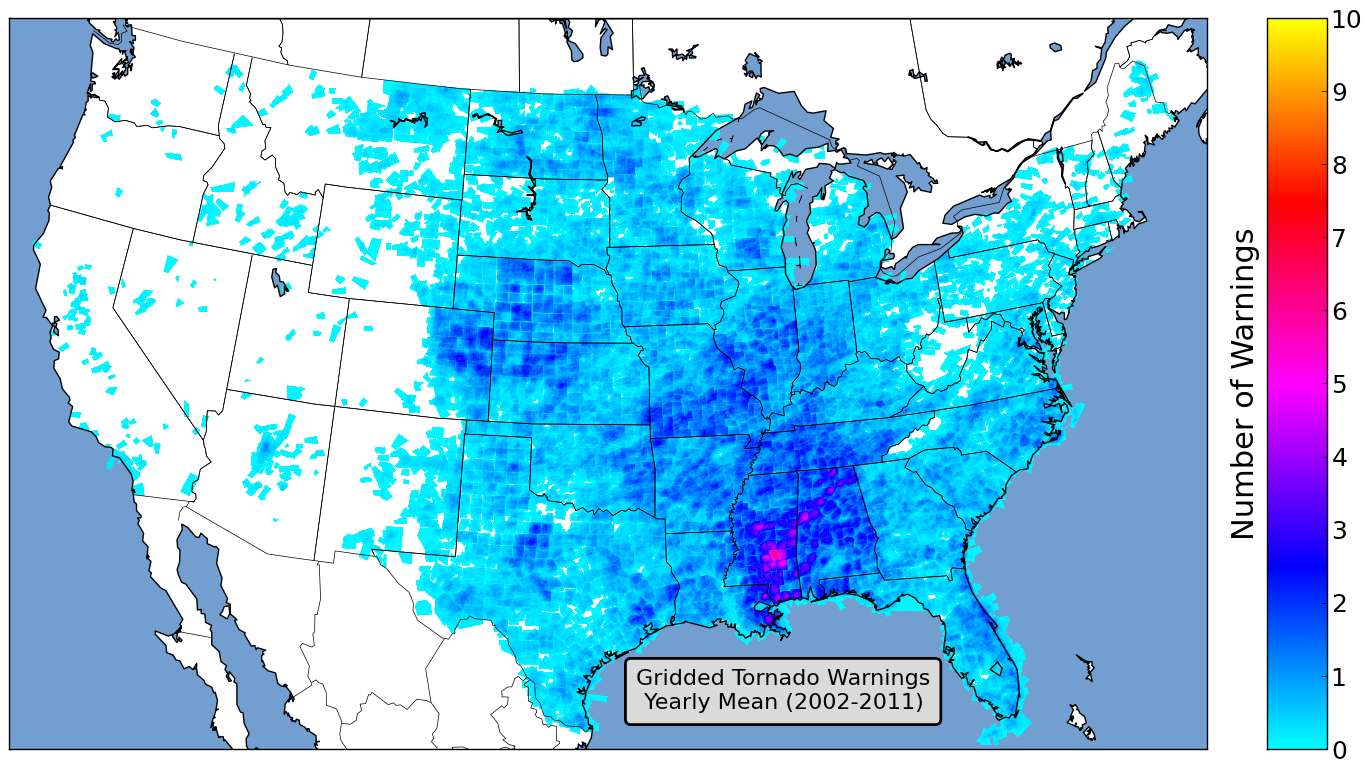
FIG 1: Yearly Mean Tornado Warnings on a 1KM grid derived from the 10-year period 2002 through 2011. Only polygon coordinates were used. (Note: This figure is not shown in the presentation. The figures shown in the presentation are divided based on the Storm-Based Warning switch date: 01 October 2007.)

Today I gave a version of my presentation on Tornado Warnings. This presentation was originally given earlier this month at the University of Alabama at Huntsville. We recorded today’s presentation so that others could see it, but I will warn you that my delivering the presentation this time did not go as smoothly as it did in Huntsville. (I stumbled over my words a couple of times and missed a few points I wanted to make.) But as a good sport, and someone who wants to see the conversation continue, I’m posting the link to the recording so that others may watch it and contribute feedback on what they thought.

When watching the presentation, a couple of questions I would love for you to keep in mind:

  • I am not an operational forecaster. No matter what I may say; no matter what I may think, I have never been in the position of actually having to issue a warning. Until I am in that position, everything I say should be considered my opinion. This seminar is in no way an attack on operational forecasters. They do a tremendous job under extremely stressful situations. This seminar is aimed at fostering a discussion on policy, not on specific actions a forecaster should or should not take.
  • Current Tornado Warning metrics center around Probability of Detection, False Alarm Ratio, and other contingency table measures. However, not every detection and not every false alarm are created equal. Are there better metrics that could be used to measure tornado warning performance? If so, what would they look like?
  • As mentioned above, not all false alarms are created equal. Furthermore, issues such as areas within the warning not being impacted by a severe event and broadcast meteorologists interrupting regular programming to cover warnings within demographic areas all give rise to the notion of perceived false alarm ratio. How can we adequately measure this, and maybe more importantly, is there anything we as a community can do to address issues arising from this?
  • Warning philosophies (severe and tornado) vary from office to office, leading to the sometimes asked question, “Do we have a single National Weather Service or 122 Local Weather Services?” Are these differing warning philosophies a good thing or a bad thing? If it is a good thing, how can we better communicate the different philosophies to users, or is that even necessary? If it is a bad thing, how do determine which philosophy(ies) do we standardize around? Or, is there a third option here that we’re (I’m) missing?
  • Should warnings be meteorology centric or people centric? Although population centers appear to show up in the datasets, is this a reflection of being people centric or merely a reflection that radar locations tend to be co-located with population centers and our understanding of thunderstorm phenomena are inherently tied to radars?
  • Instead of moving toward an Impact Based Warning paradigm, or a tiered warning paradigm, is it time to consider including probabilities or other means of communicating certainty/uncertainty information into the warning process? If so, how do we go about doing this in a manner that does not leave the users of these products behind? In other words, how do we move toward an uncertainty paradigm in which average citizens can understand?

I firmly believe that the warning system in place has undoubtedly saved thousands of lives throughout it’s history. However, I do believe that it has problems and stands to be improved. However, I cannot put into words what the problem(s) is(are). I believe that it will require community efforts to address these problems. This includes all of the severe weather community: research meteorologists, operational meteorologist, NWS management, emergency managers, broadcast meteorologists, and, maybe the most overlooked piece, social scientists.

Lastly, I must apologize to Greg Blumberg for coming across much harsher than I intended to when addressing a comment he made during the presentation. My response was intended in jest since I know Greg, but that didn’t come across to everyone in the audience, which tells me I shouldn’t have said it. Greg, my sincerest apologies, and I hope you understand that my response was entirely in jest.

With that said, I hope you enjoy the presentation, and I look forward to hearing your ideas!