Playing with Data

Personal Views Expressed in Data

POLL: Understanding Probabilistic Forecasting

"If you were completely unsure as to whether it would rain tomorrow, what probability of precipitation should you forecast?"

The answers to this question are something to which I've long been interested. I would appreciate it if you would register your answer below. I'll leave the poll up for a few days, after which I'll write a new post with the results and the correct answer.

Please share this poll with your friends and colleagues. However, if you do share this poll, please do not "explain" your answer. I would like to try and get people's personal thoughts on this question; not necessarily the correct answer. For this reason, and this reason alone, I have turned off comments for this particular post.

Please note that this poll is informal and anonymous. No personal information is being collected! Lastly, when clicking either the "vote" or "view" buttons, you will be taken to the poll hosting company's website. You can use the back button to return to this page.

If you were completely unsure as to whether it would rain tomorrow,
what probability of precipitation should you forecast?
  
pollcode.com free polls 

SPC Outlooks and the Traditional School Year

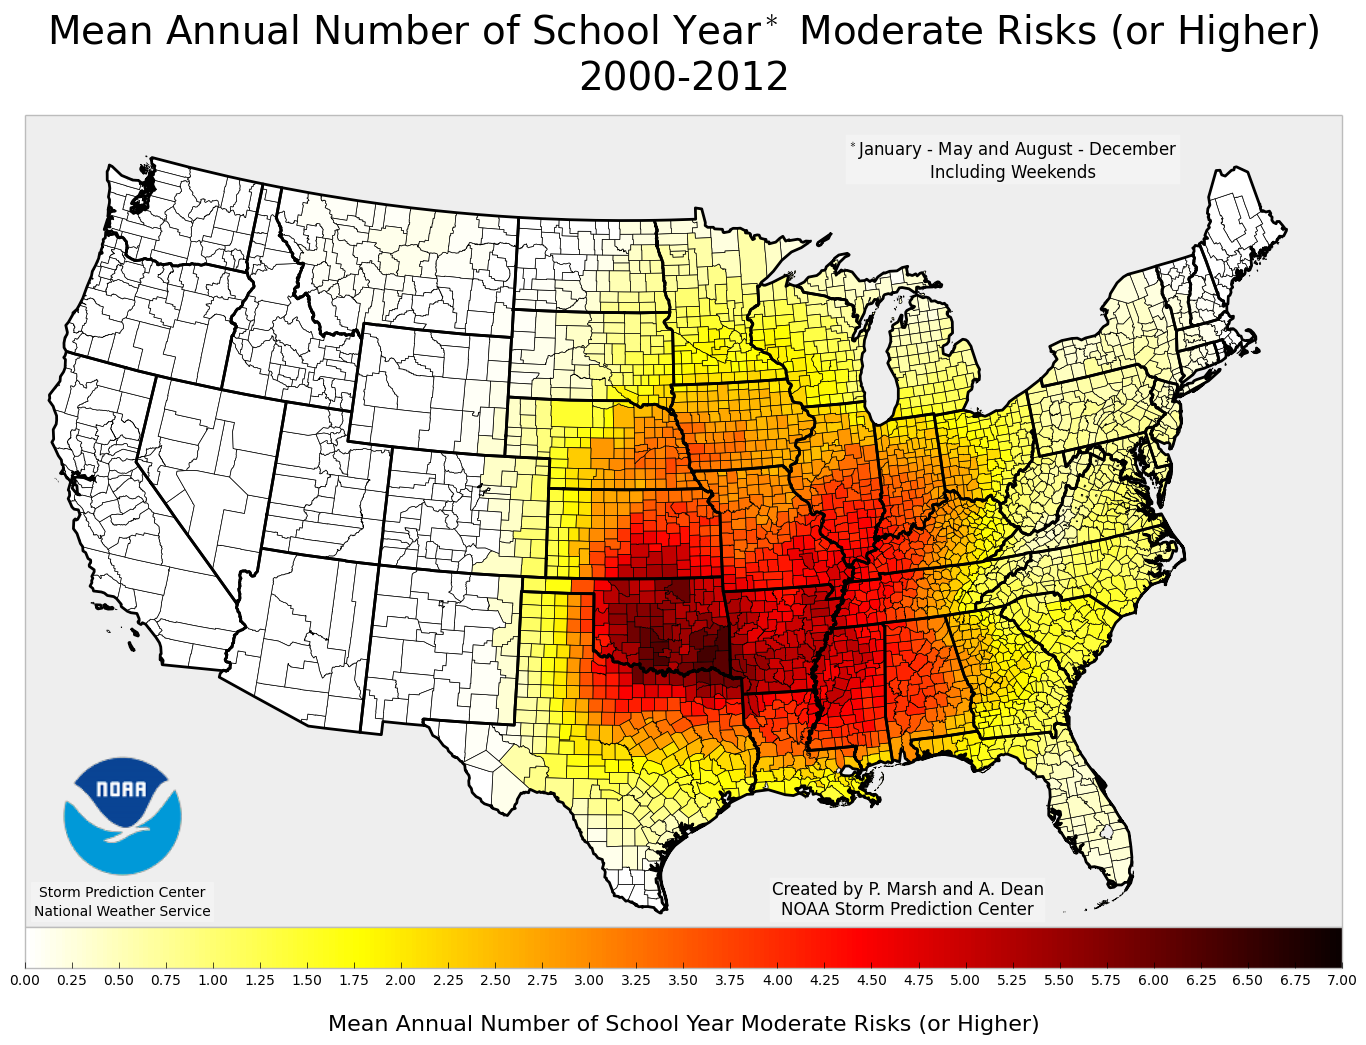
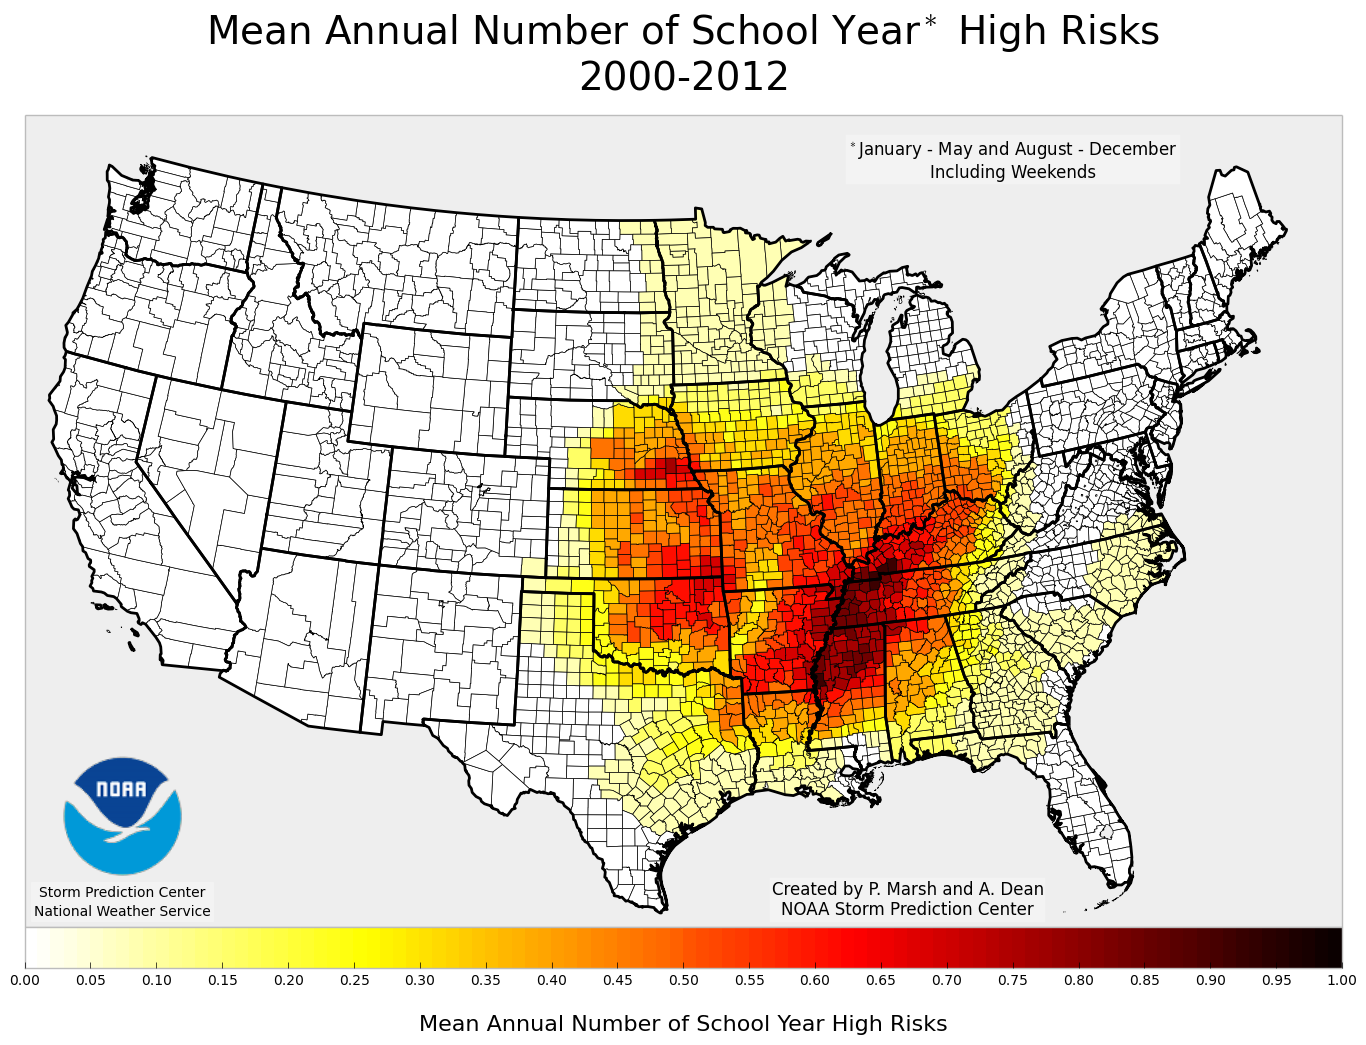
A couple of days ago I wrote about the Oklahoma School Year and Severe Weather. I had several requests to expand that analysis to additional areas. This is a fairly trivial task for determining the mean annual number of NOAA Storm Prediction Center Slight/Moderate/High Risks during the "Traditional School Year" as these products are valid for "days". (Note: I define the "Traditional School Year" as being from 01 August - 31 May, inclusive. This means weekends and holidays are included.) It is much more difficult dealing with the watches as this is dependent upon things such as time zones, which makes preprocessing the data a bit more difficult. As such, this post addresses half of the request I had received: the NOAA Storm Prediction Center's Severe Weather Outlooks per county during the "traditional" school year using data from 2000 through the end of 2012.

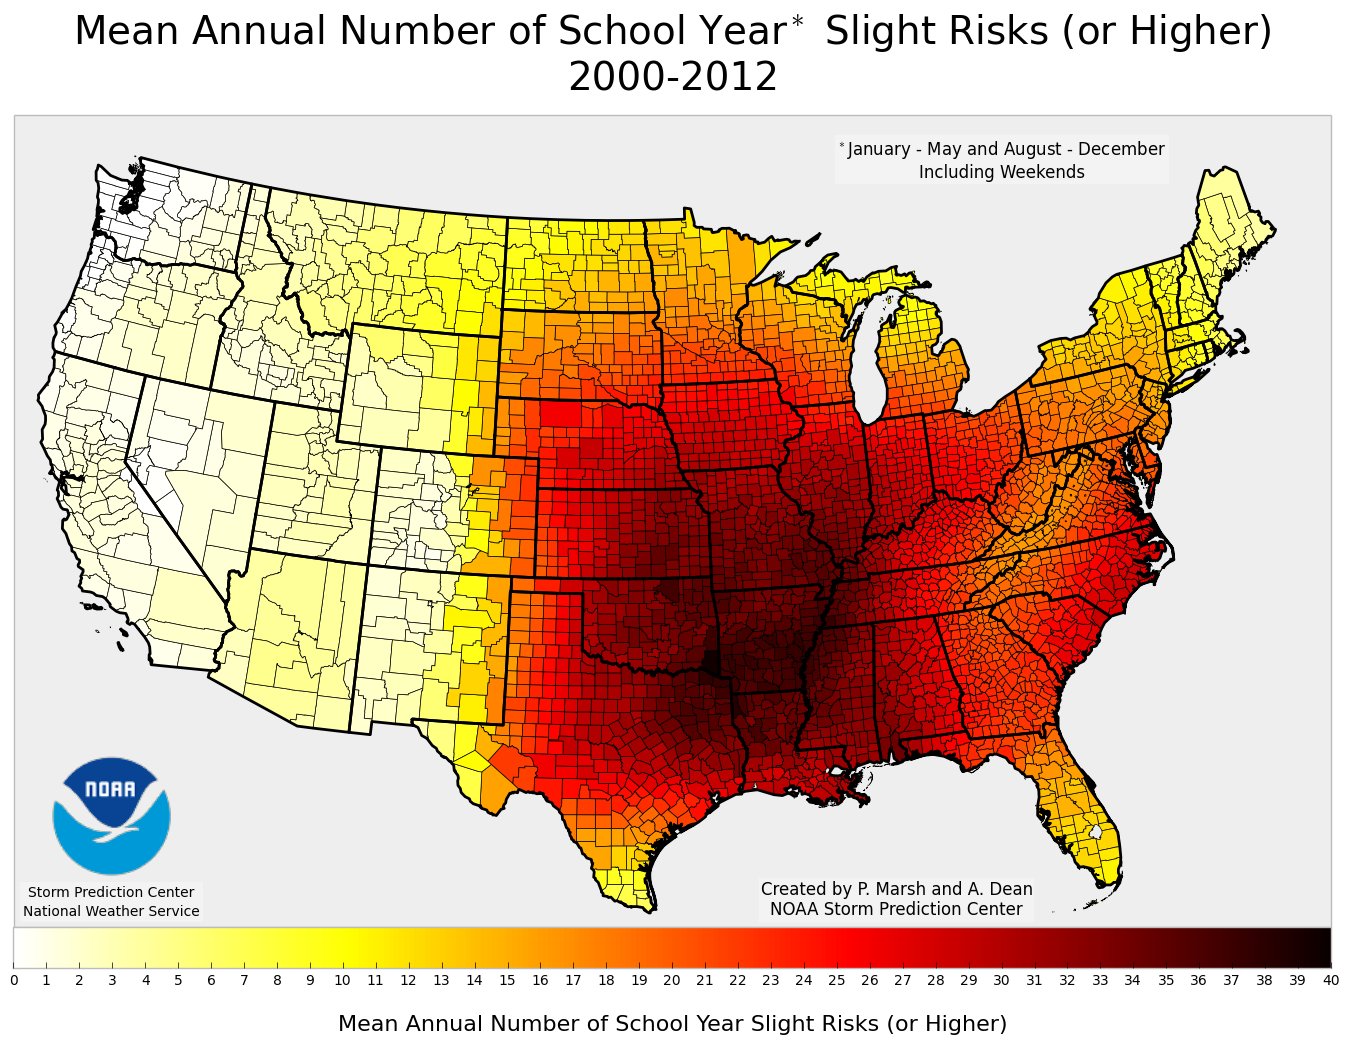
Below is the mean number of slight risk (or higher) outlooks for the traditional school year. As you can see, most areas east of the Rocky Mountains experience at least 1 slight risk (or higher) per school year. The maximum (nearly 37 days) is in southeast Oklahoma, and the centroid appearing to be in north-central Arkansas.

Below is the mean number of moderate risk (or higher) outlooks for the traditional school year. As you can see, once again, most areas east of the Rocky Mountains experience at least 1 moderate risk (or higher) per school year. The maximum (nearly 7 days) is located across much of Oklahoma, and the centroid appears to once again be located in the vicinity of Arkansas.

Below is the mean number of high risk outlooks for the traditional school year. Here, there appears to be two separate areas of high risk occurrences: one over the plains, and another in the Mississippi Valley. In fact, there is a relative minimum in occurrence across western Arkansas that serves as some sort of delineation between these two regimes. No area experiences at least 1 high risk day (on average), but the maximum (which is nearly 1) is located from northern Mississippi into southwestern Kentucky. The maximum in the plains appears to be located from northern Oklahoma [mainly the northeastern portion] northward into extreme southeastern Nebraska.

Oklahoma School Year and Severe Weather

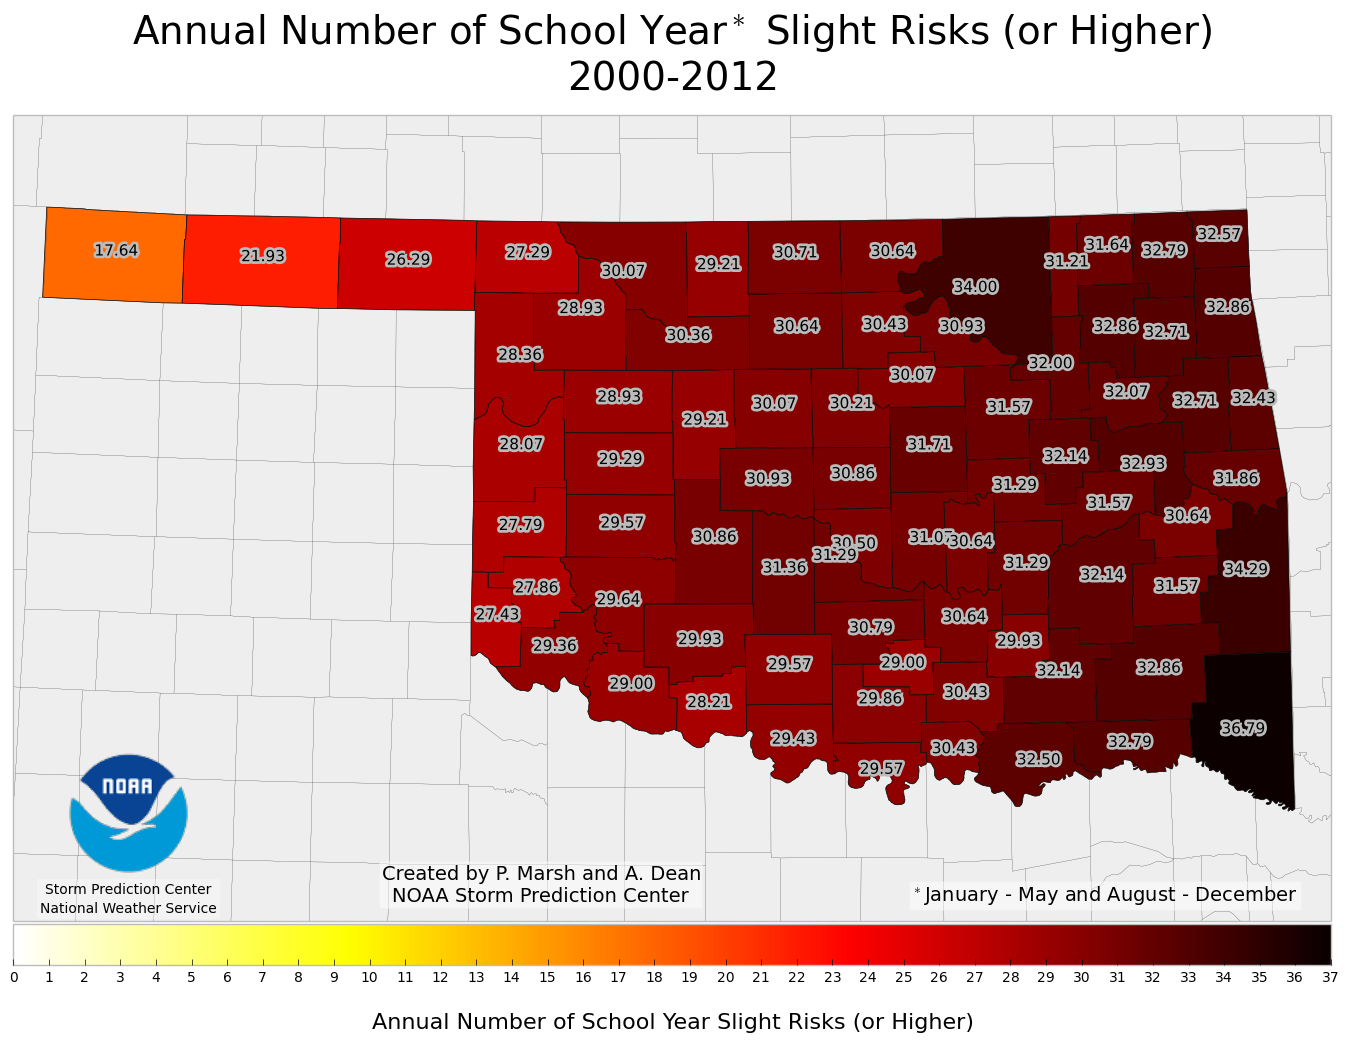
With the school year either already begun, or about to begin, for much of Oklahoma, I thought I'd write a post about the Oklahoma School Year and severe weather. For these results, I've identified the school year as every day between the months of January through (and including) May as well as August through (and including) December. (Note, this means that I am including weekend days in this calculation.) Additionally, I am using the Storm Prediction Center's outlook data from January 2000 through the end of 2012.

Below is plot of the average annual number of school days (including weekends) in which each Oklahoma county was placed in a Storm Prediction Center Slight Risk (or a higher risk category). As you can see, this ranges anywhere from 17 days in the far western Oklahoma Panhandle to around 37 days in southeastern Oklahoma.
Next is a plot of the average annual number of school days (including weekends) in which each Oklahoma county was placed in a Storm Prediction Center Moderate Risk (or a higher risk category). As you can see, this ranges anywhere from about 1 day in the far western Oklahoma Panhandle to around 6 days in southeastern Oklahoma.

Next is a plot of the average annual number of school days (including weekends) in which each Oklahoma county was placed in a Storm Prediction Center High Risk. As you can see, this ranges anywhere from almost never in the far western Oklahoma Panhandle to around once every 2 years in northeastern Oklahoma.

Most of the spatial pattern comes from the annual cycle of the climatological probabilities of severe weather occurrence. What I mean by this is that during the "cool season" (late fall through early spring), the higher climatological probabilities of severe weather occurrence are in the southeastern United States. As spring begins, the climatological peak values begin to expand and increase into the southern plains. This means that southeast Oklahoma spends more time in the climatological peak during its school year, because the rest of Oklahoma spends time in its climatological peak when the school year has ended. This is especially true with the Oklahoma Panhandle, which doesn't see it's climatological peaks until very late May into late June.

Of note is that it is actually northeast Oklahoma that has a higher likelihood of experiencing a High Risk during the school year than anywhere else in the state. Based on my previous explanation, one might have thought that southeast Oklahoma would be the expectant maximum of High Risks. My guess is that this is due to the fact that High Risks are rare, and require a rare combination of ingredients coming together, as is evident by the relatively few times they are issued. One of these ingredients is an extremely strong, dynamical storm. When this is the case, for reasons I won't get into here (partly because I don't think meteorologists are completely sure), these storm systems tend to track a little bit farther north. This results in northern preference for high risks. Additionally, a lot of moisture is needed to help produce large amounts of instability. Given that the Gulf of Mexico is slightly east of our longitude, it's easier for moisture to return to eastern Oklahoma than western Oklahoma.

The previous charts might make it seem like Oklahoma school children are exposed to a lot of severe weather during the school day. However, this isn't necessarily the case. The outlooks cover time periods that extend past the bounds of the school day (7AM to 4PM for my purposes). Thus, it is possible that the severe weather might have occurred after school let out, or even before the school day began. To begin looking at that possibility, below are some maps of the number of watches issued during the school day, during the school year. This time I will be using SPC watches from January 2000 - the end of May 2013. (Once again, note that weekends are included in the analysis.)

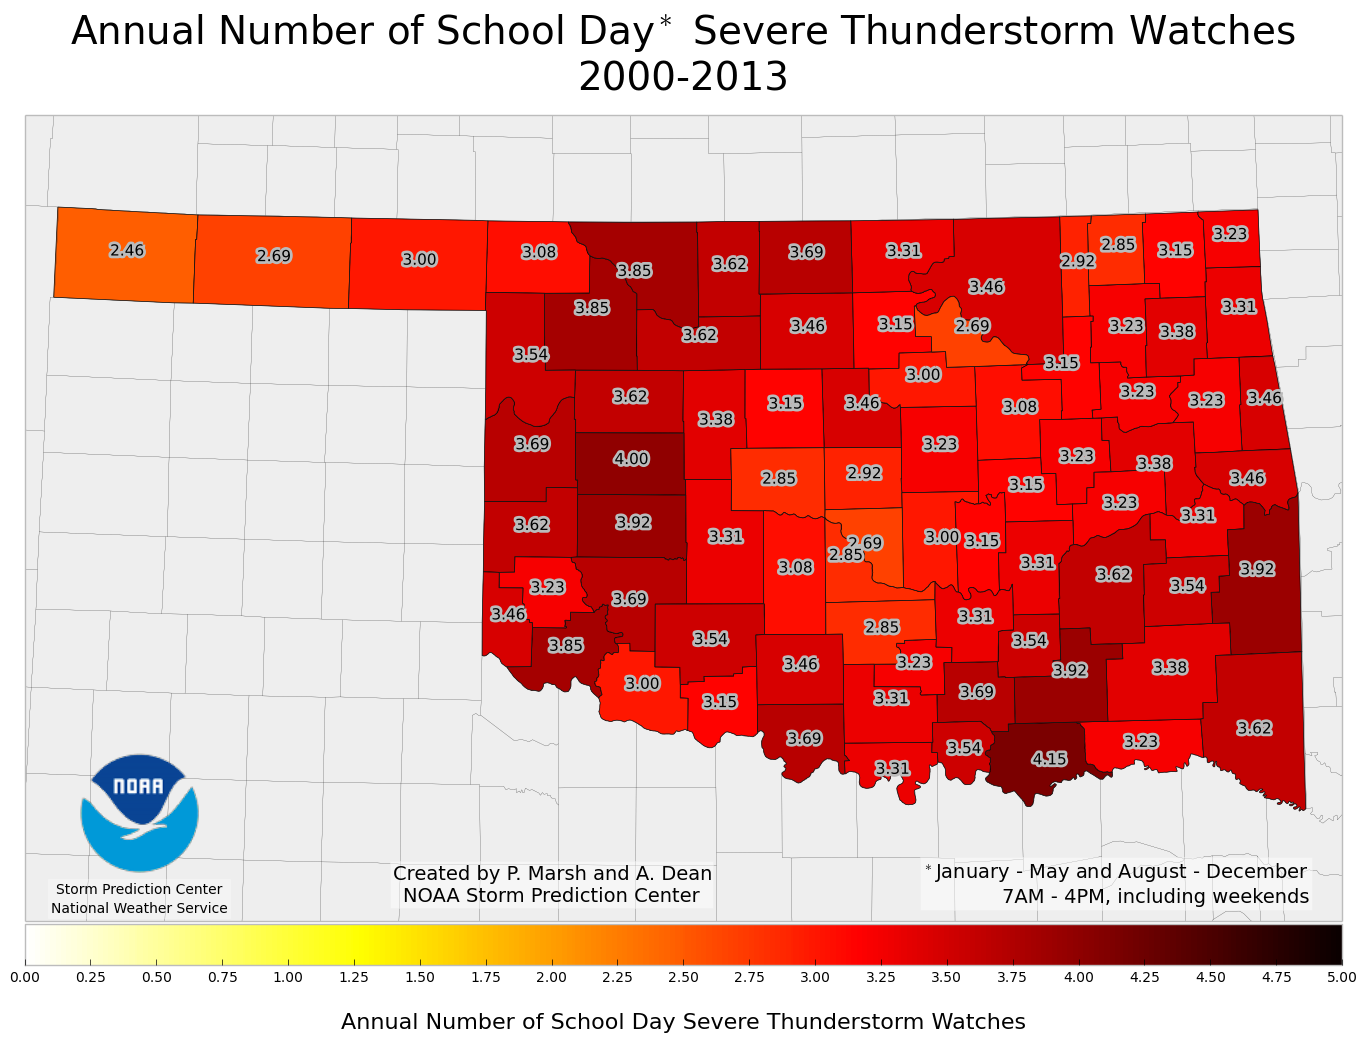
Below is a plot of the average annual number of SPC Severe Thunderstorm Watches issued between 7AM and 4PM during the school year (weekends included). As you can see, this ranges from around 2.5 in the far western Oklahoma Panhandle to slightly more than 4 in southeast Oklahoma.
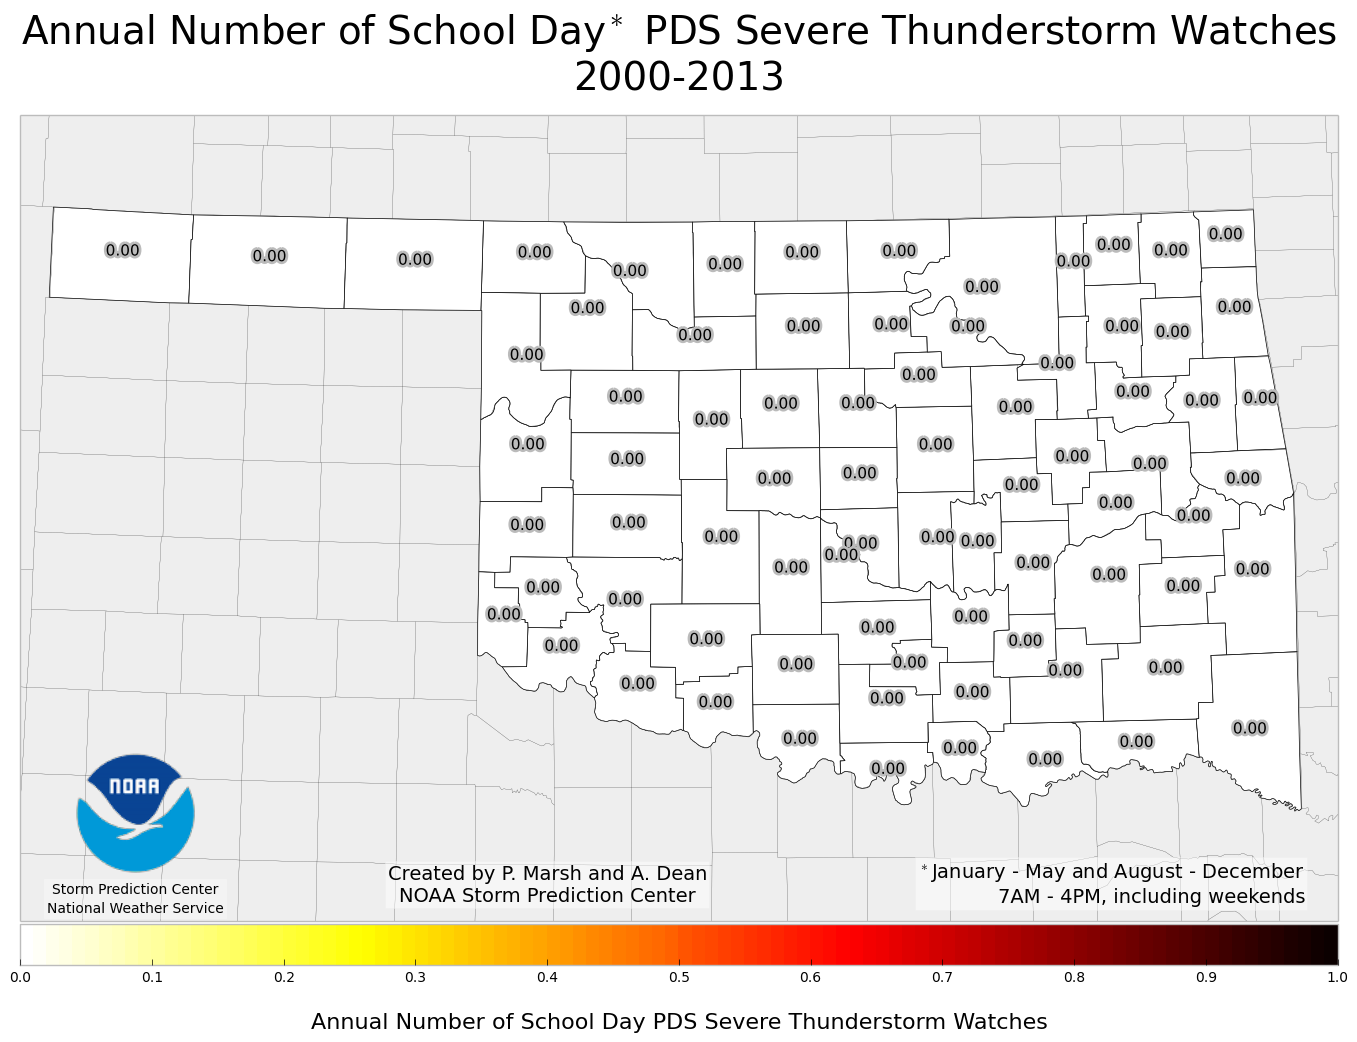
Below is a plot of the average annual number of SPC Particularly Dangerous Situation (PDS) Severe Thunderstorm Watches issued between 7AM and 4PM during the school year (weekends included). As you can see, this has not happened since 2000.
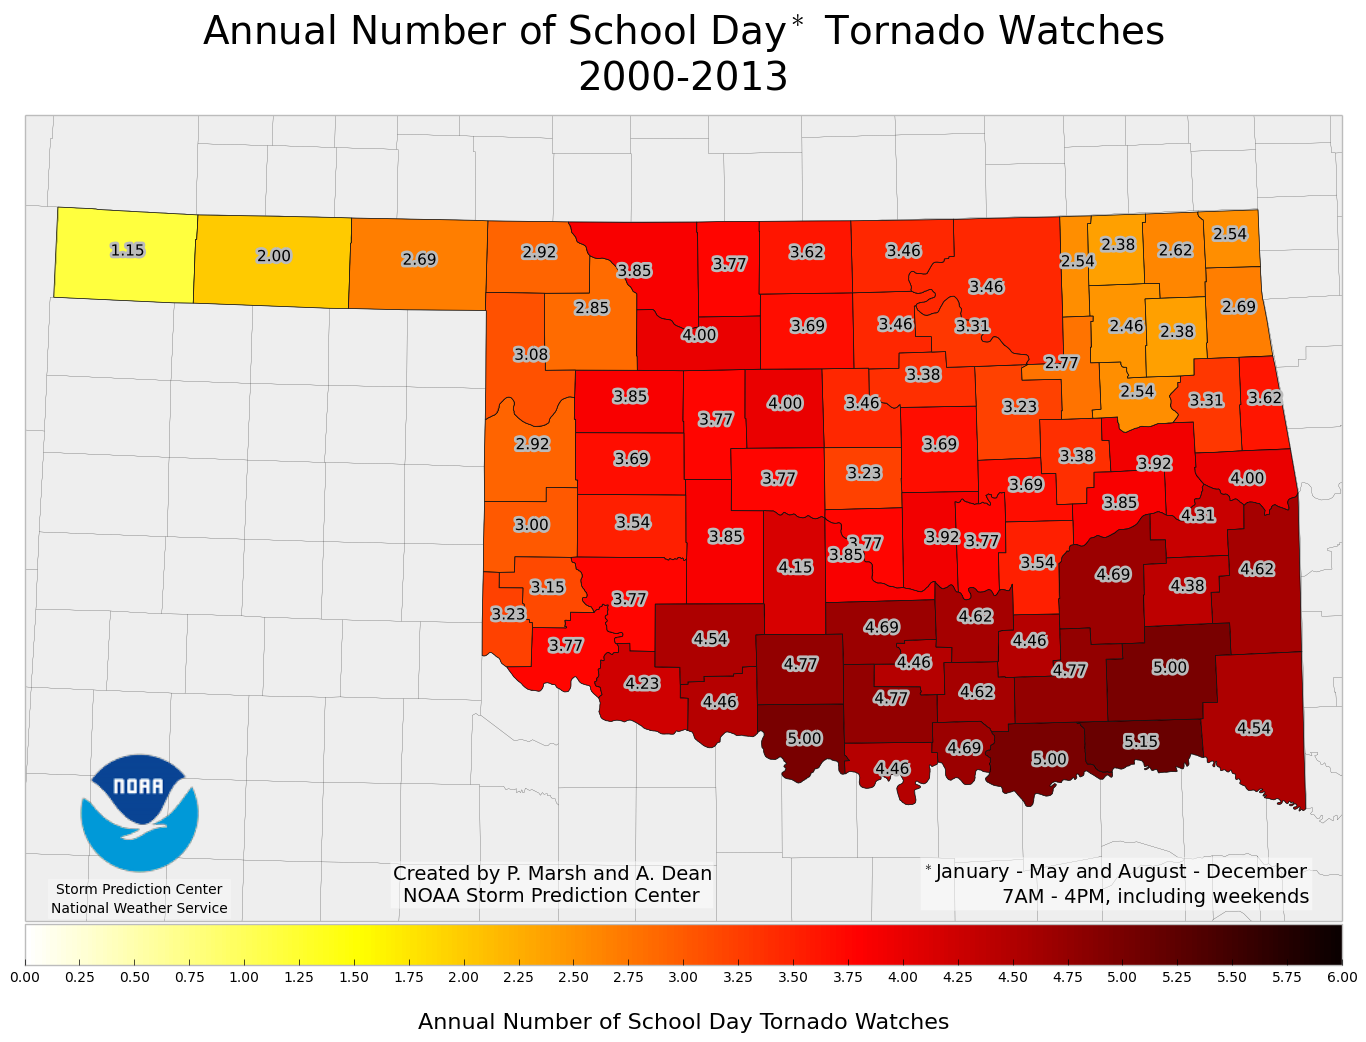
Below is a plot of the average annual number of SPC Tornado Watches issued between 7AM and 4PM during the school year (weekends included). As you can see, this ranges from around 1 in the far western Oklahoma Panhandle to slightly more than 5 in southeast Oklahoma.
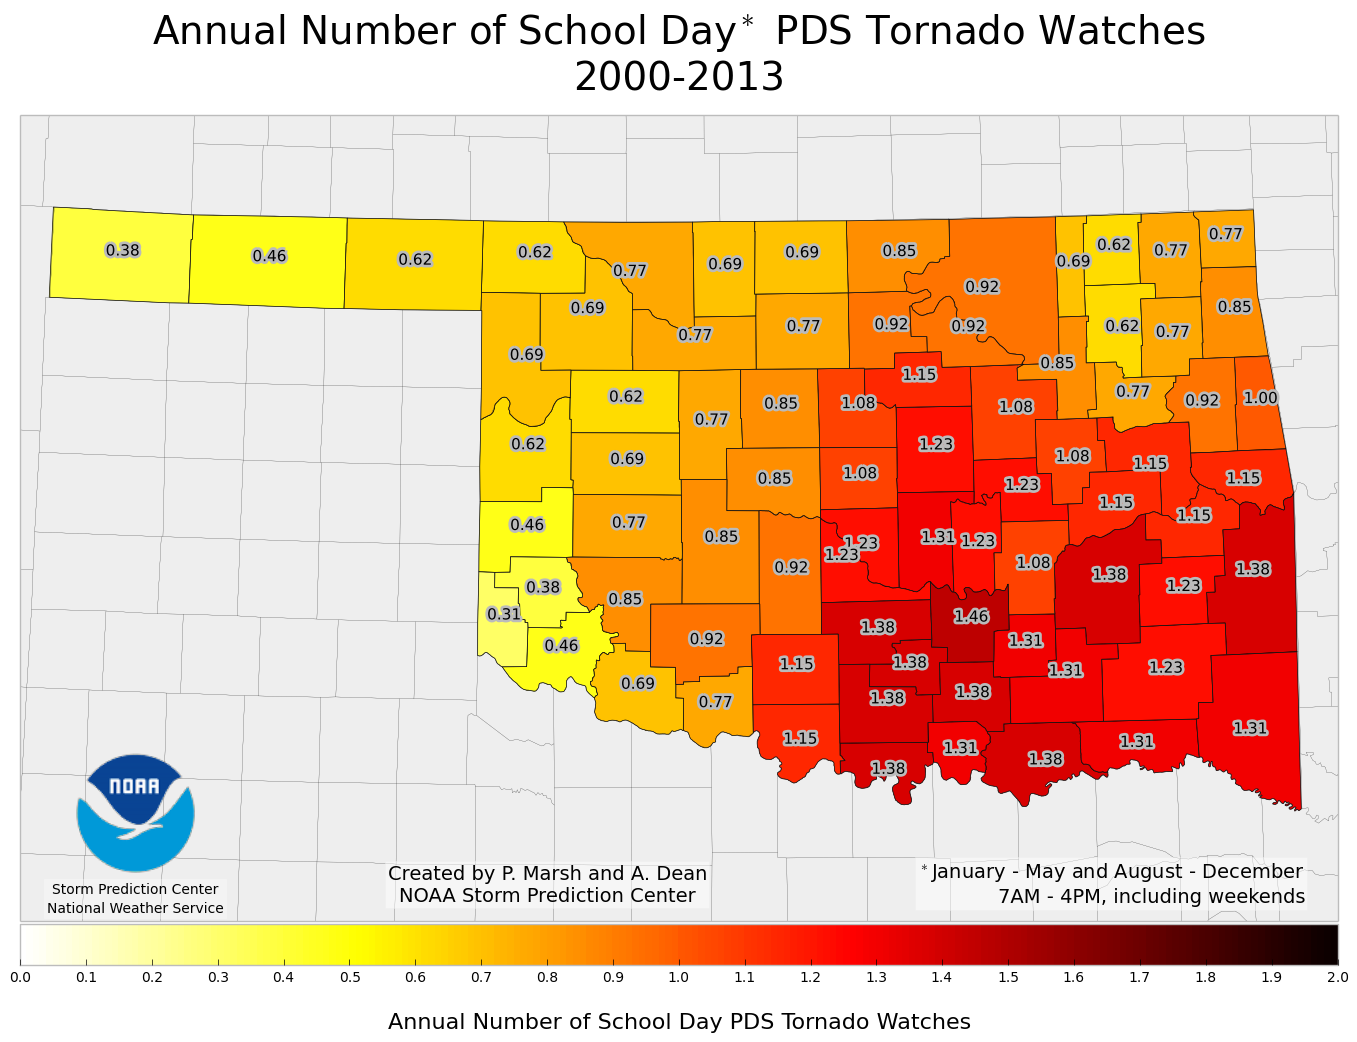
Below is a plot of the average annual number of SPC Particularly Dangerous Situation (PDS) Tornado Watches issued between 7AM and 4PM during the school year (weekends included). As you can see, this ranges from around 0.3 (or once every three years) in the far western Oklahoma Panhandle to around 1.3 in southeast Oklahoma.
Taking a look in aggregate, below is a plot of the average annual number of SPC Watches of any kind issued between 7AM and 4PM during the school year (weekends included). As you can see, this ranges from around 3.5 in the far western Oklahoma Panhandle to slightly more than 9 in southeast Oklahoma.
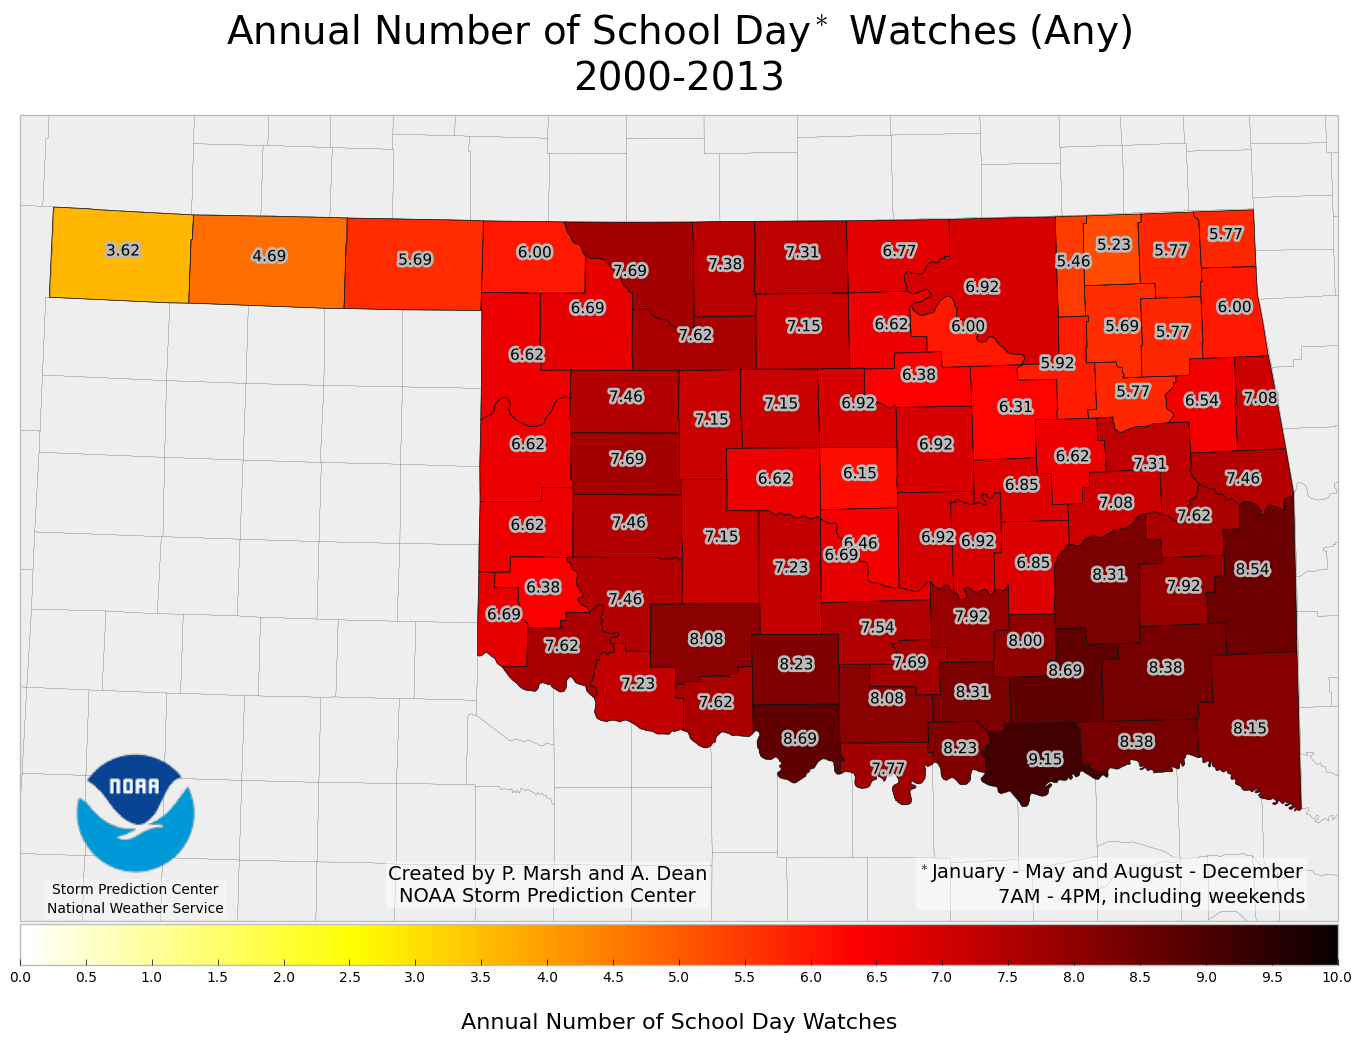
Thus, even though the a large part of the state experiences on average around 30-40 days of severe weather during the school year, less than 10 of those events (on average) occur during the school day itself. With that said, it only takes one event to completely ruin a school year...and a community. The 20 May 2013 Moore, OK tornado is a pointed reminder of this fact.
Why Should I Continue as an AMS Member?

Author Update: AMS has now added an editor's note/disclaimer on the blog post.

Earlier today on the American Meteorological Society (AMS; of which I am a member) blog, a post was published that advocated for the privitization of weather forecasts. In a nutshell, the blog post suggested that the US government, and more specifically the National Weather Service, is inefficient in its generation of forecasts and therefore should stick to the mission of generating and providing raw data and discontinue the creation of weather forecasts. The blog post goes on to state that the US government could/should purchase forecasts from private companies for citizens that cannot afford to purchase their own forecasts. Although as an American citizen I find this arrangement unacceptable, and yet another attempt at privitizing profits (removing the government forecasts) and socializing losses (the generation/collection of the data), I will leave that discussion for another time and place.

My real issue is not so much the fact that a private weather company is advocating for this arrangement, it is that the AMS allowed such a post to be featured on their blog without opposing viewpoints. Whether or not the AMS agrees, their blog is a reflection of the AMS and its positions. By allowing such a post to be published publicly, without differing views, the AMS is implicitly endorsing this position. The AMS has implicitly chosen a side --- especially when no disclaimer saying otherwise can be found on the website! (I understand that the particular position being advocated in this blog post is not the official position of the AMS. However, the simple fact is that an overwhelming majority of people will not take the time to delve into the nitty-gritty details and jargon of AMS position statements.) Why on earth would the AMS think that featuring/allowing a blog post, on the organization's website, that attacks a portion of the AMS's constituency, without allowing that constituency's view to be shared, would be a good idea? If the AMS membership wants to have this discussion, I'm all for it. Positions and views should always be debated and discussed openly and freely. However, we should have this dicussion amongst the membership, and then share the discussion/consensus, rather than have the opening salvo feature one side of the discussion. The fact that this post is featured on the website the week before the AMS Community Meeting is to be held leads credence to this appearing as an official AMS position.

Ironically, this morning I received my yearly email from AMS reminding me that it is time to renew my membership for the upcoming year. Based on the apparent AMS position on government meteorologists/forecasters, I seriously wonder why a government meteorologist/forecaster would want to be a member of the AMS? Fortunately, there are alternatives to the AMS for a professional society. One in particular is the National Weather Association (NWA), of which I'm also a member. Maybe if enough government meteorologists left the AMS and became more active in the NWA, the AMS would re-evaluate their policies that allow members to promote positions that alienate a significant portion of its contiuency. Maybe this is a sign to leave the AMS (and the committees I'm currently on) and focus solely on the NWA? Without an apology/correction/disclaimer from the AMS --- and soon --- my tendency would be toward leaving. Fortunately, I have a few months to see what the AMS does...

Updated Tornado Count Model

Yesterday I published a post that attempted to model tornado counts in a manner that would allow insights into just how rare the current "tornado drought" and recent "tornado surplus" actually are. There are numerous limitations to these simple models, but two that really stand out are:

  • 2010, 2011, and 2012 all contribute tornado counts to either the record minimum or record maximum tornado counts.
  • The simple models used only generate "years" that begin with January and run through December. This excludes the possibility for the inter-year 12-month counts, such as what comprises the current record minimum and maximum.

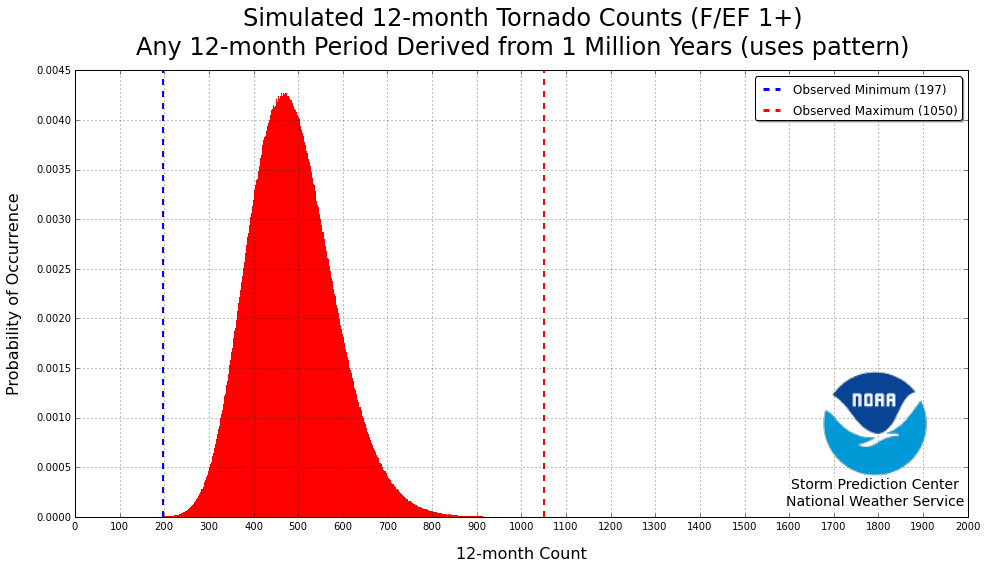
In an attempt to address the first bullet, I have removed the years 2010, 2011, and 2012 from the input data. In an attempt to address the second bullet, I created 12-month running totals from the 1 million years. Thus, the modeled distribution includes 12-month periods of January through December; April through March (of the following year); November through October (of the following year); etc.

Removing 2010, 2011, and 2012 --- in particular 2011 --- the right-tail of the distribution is significantly altered. The maximum 12-month tornado counts are actually fewer than they were in the previous models. This was expected as 2011 was such an anomalous year in terms of the number of tornadoes (as the residents of the Southeast can attest to). The thought is that by removing the influence of 2011 the modeled distribution would more closely resemble "truth".

The new distribution is shown below.

In the new model, the minimum number of 12-month tornadoes was 160, with 1143 the maximum. The maximum number of tornadoes from this new model is quite a few less than the even simpler models previously used. This results in a significant change in the rarity of the 2010-2011 record 12-month maximum. As is shown below, it is actually substantially more rare of an event than the current tornado drought.

  • Simulated Minimum (160) (Probability: ~0
  • Observed Minimum (197) Probability: 0.0000223333538056
  • Observed Maximum (1050) Probability: 0.999998666665 (0.0000013333)
  • Simulated Maximum (1143) Probability: ~1.0 (~0)
  • Return Period for Observed Minimum: 44776.0783582 months (3731.33986318 years).
  • Return Period for Observed Maximum: 749999.313258 months (62499.9427715 years).

By removing the influence of 2011, the return period for the maximum record (1050 tornadoes) between June 2010 and May 2011 is 749,999 months, or 62,500 years. By removing the influence of 2012, the return period for the minimum record (197) tornadoes between May 2012 and April 2013 is 44,776 months, or 3731 years. Thus, when removing the years contributing to the most and fewest tornado counts, the rarity is almost opposite as to what the previous, simpler models found.

Lastly, just a reminder that even though these models are somewhat complex in (some of) their logic, they are relatively simple models in the grand scheme of things. Anytime one tries to understand/predict things about extreme events the slightest changes to the underlying assumptions can have a profound impact in the results, as is illustrated by the switching of the rarity between this model and those used yesterday.