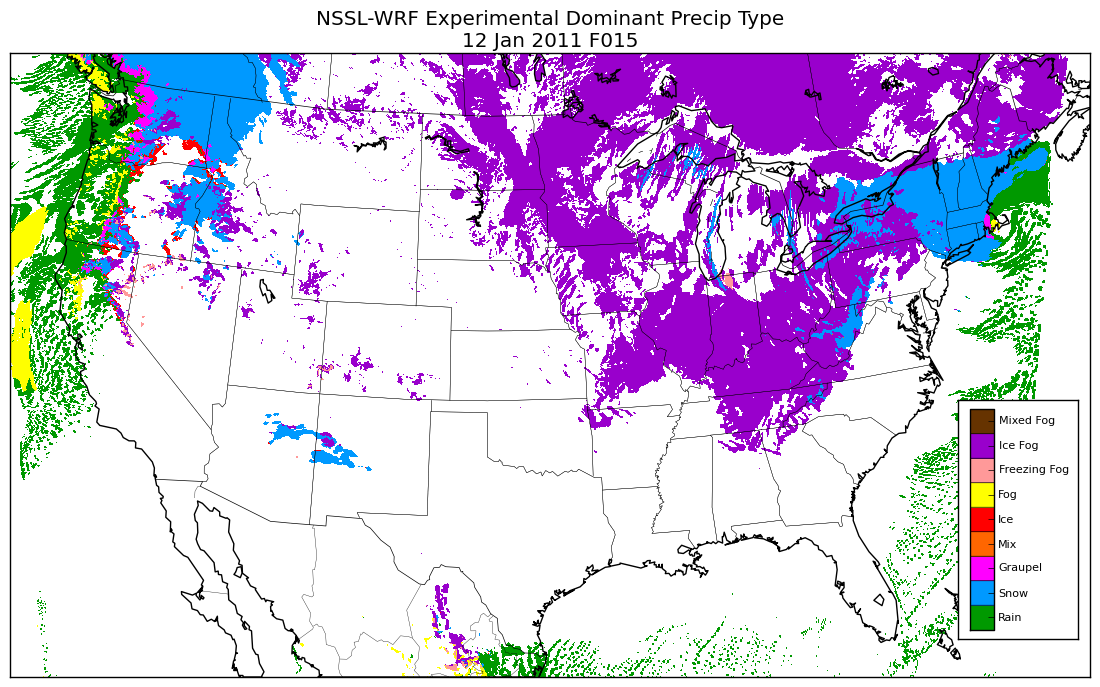
Back in December I started experimenting with producing precipitation type graphics from the 00 UTC initialization of a 4km WRF run daily at the National Severe Storms Laboratory (NSSL) based on suggestions from Jack Kain and Scott Dembek. The idea was to take the dominant hydrometeor from the lowest model level from the microphysics scheme (WSM6) and then assign a precipitation type. Currently I’m creating 9 different precipitation types based on the 5 different hydrometeor types from the model.
How these 9 precipitation types are calculated are given below:
- Rain: Rain water is the dominant hydrometeor type
- Snow: Snow is the dominant hydrometeor type
- Graupel: Grapuel is the dominant hydrometeor type
- Fog: Cloud water is the dominant hydrometeor type
- Ice Fog: Cloud ice is the dominant hydrometeor type
- Mix: Snow == Rain or Snow == Graupel or Rain == Graupel
- Ice: Rain water is the dominant hydrometeor type, and the temperature is at or below 273.15K
- Freezing Fog: Cloud water is the hydrometeor and the temperature is at or below 273.15K
- Mixed Fog: Fog == Ice Fog, Fog == Freezing Fog, or Ice Fog == Freezing Fog
This EXPERIMENTAL output is updated in the morning (not when the typical model output is available) and is currently linked on the main NSSL-WRF webpage on the left hand side (second of the products). A 36 hour loop is here.
I’d ask those who tend to look at weather maps on a daily basis to consider looking at this product and provide feedback on it. We know there are issues regarding the over-forecast of “ice fog” (and possibly even other fog), but are there other problems? Again, this is highly experimental and may not always be up to date. (The model initialization time will always be plotted on the image.) Any/all feedback is greatly appreciated.
