Since I forgot to post a this week due to continued winter weather, and because the snow battered center of the United States has begun its long awaited warm-up, I thought I’d go ahead and share the statistics and figures relating to February tornadoes. The plots and statistics are similar to those I computed for January that can be found in posts here and here.
February Averages (based on data from 1950 – 2009)
24.5 tornadoes
128.3 injuries
10 fatalities
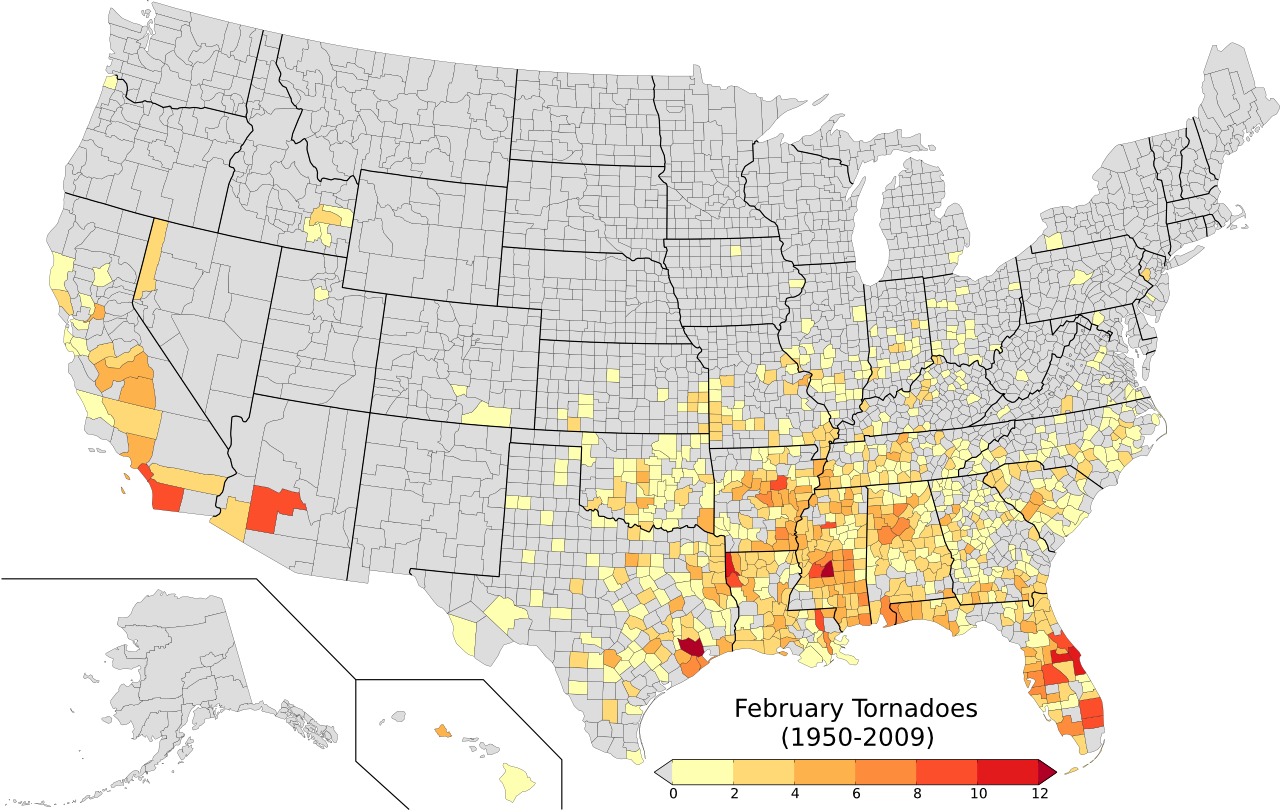
Above is a figure depicting the number of February tornadoes per county for the years 1950 to 2009. Most tornadoes tend to occur in the southeast United States, however tornadoes have been reported as far west as California and Hawaii, and as far north as Oregon and western New York!
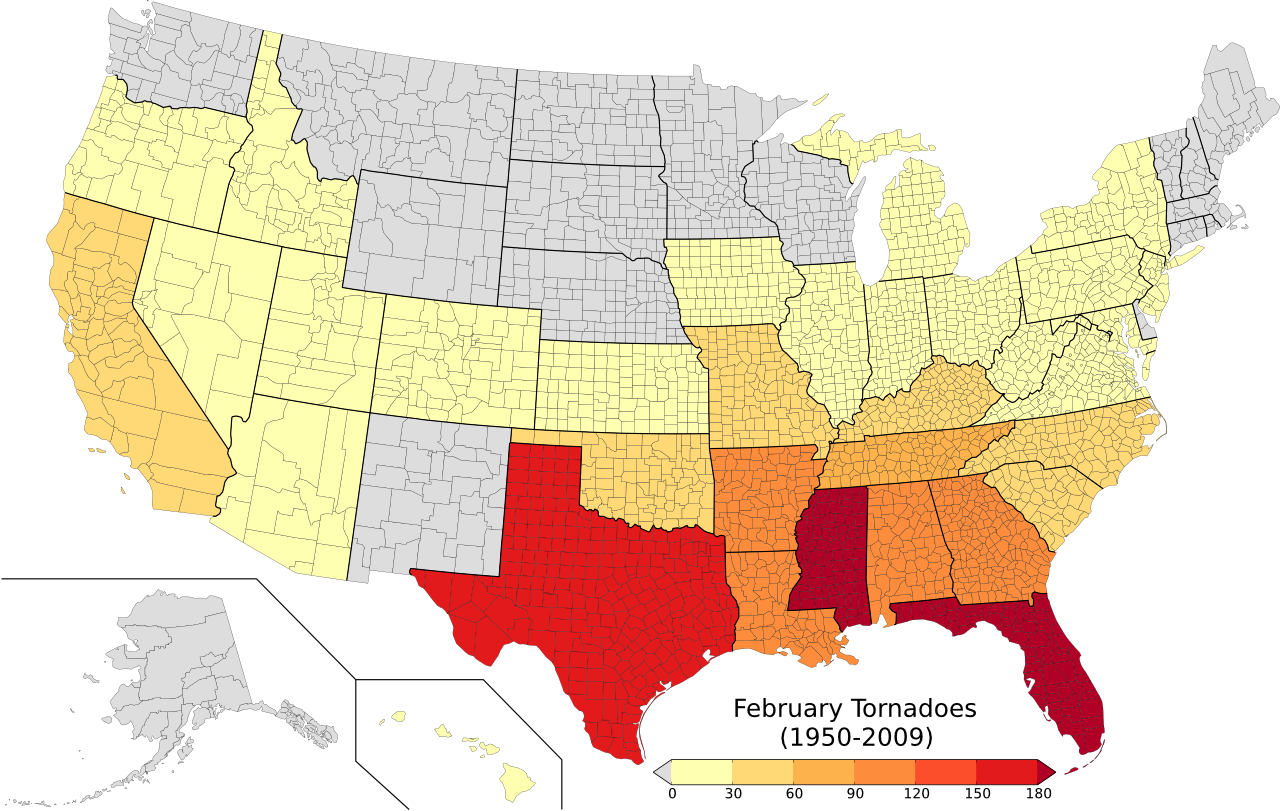
If we sum up the number of unique tornadoes from the country data and turn it into the number of tornadoes by state, it would look like this:
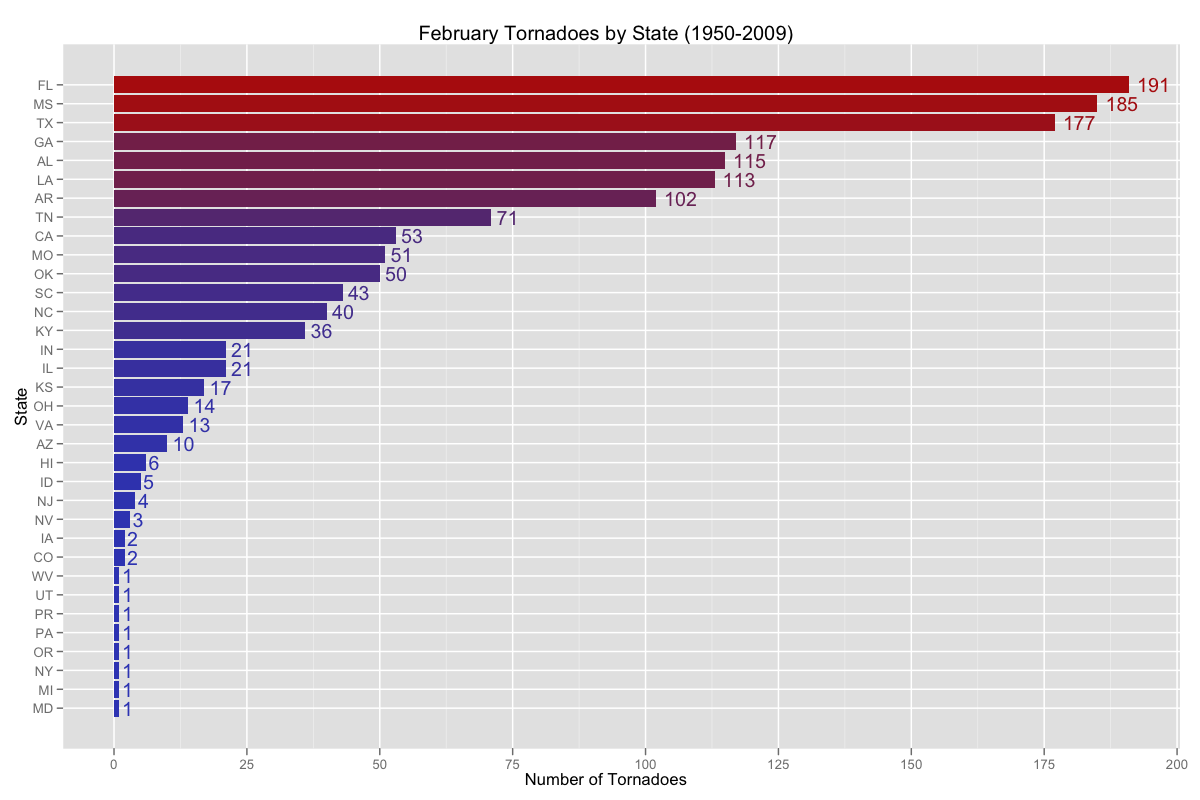
Florida and Mississippi lead the way with over 180 tornadoes, followed by Texas and then the rest of the southeastern states. Breaking down each states numbers, the tallies look like this:
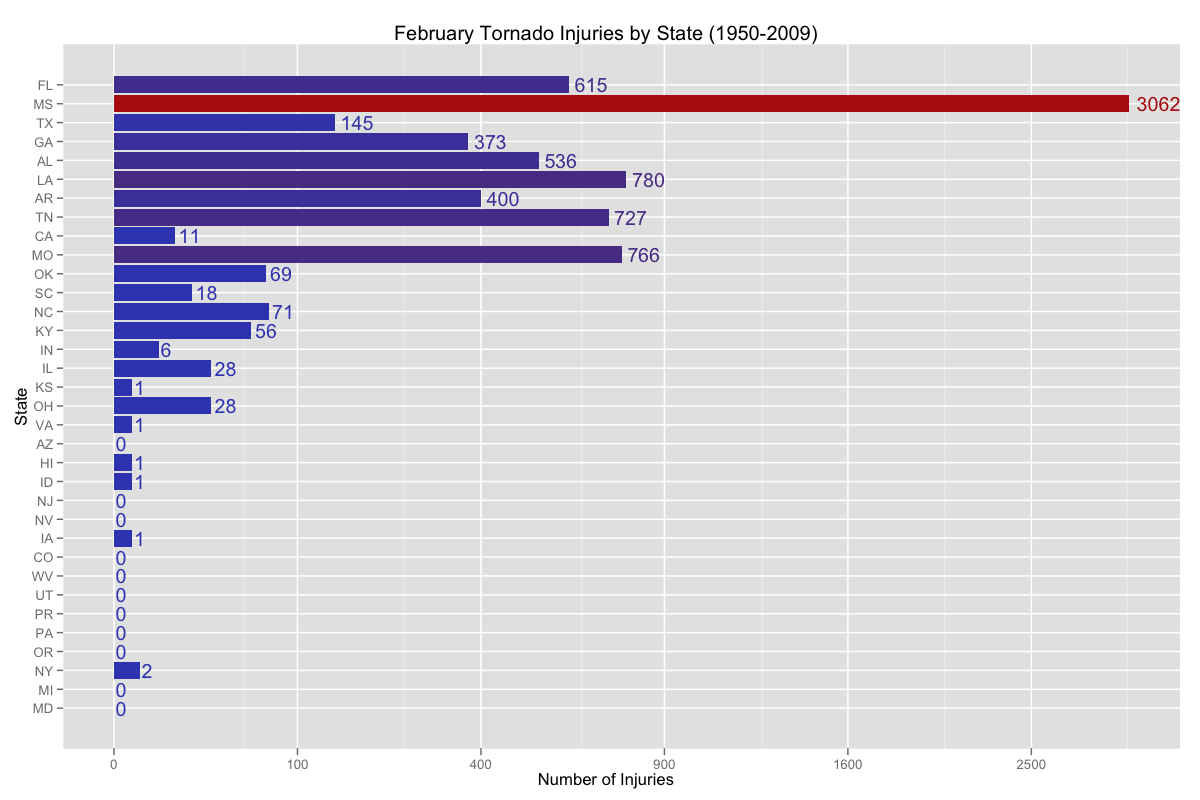
Now, the number of injuries per state break down as follows (please note the order of the states listed on the left is in descending order of number of tornadoes per state):
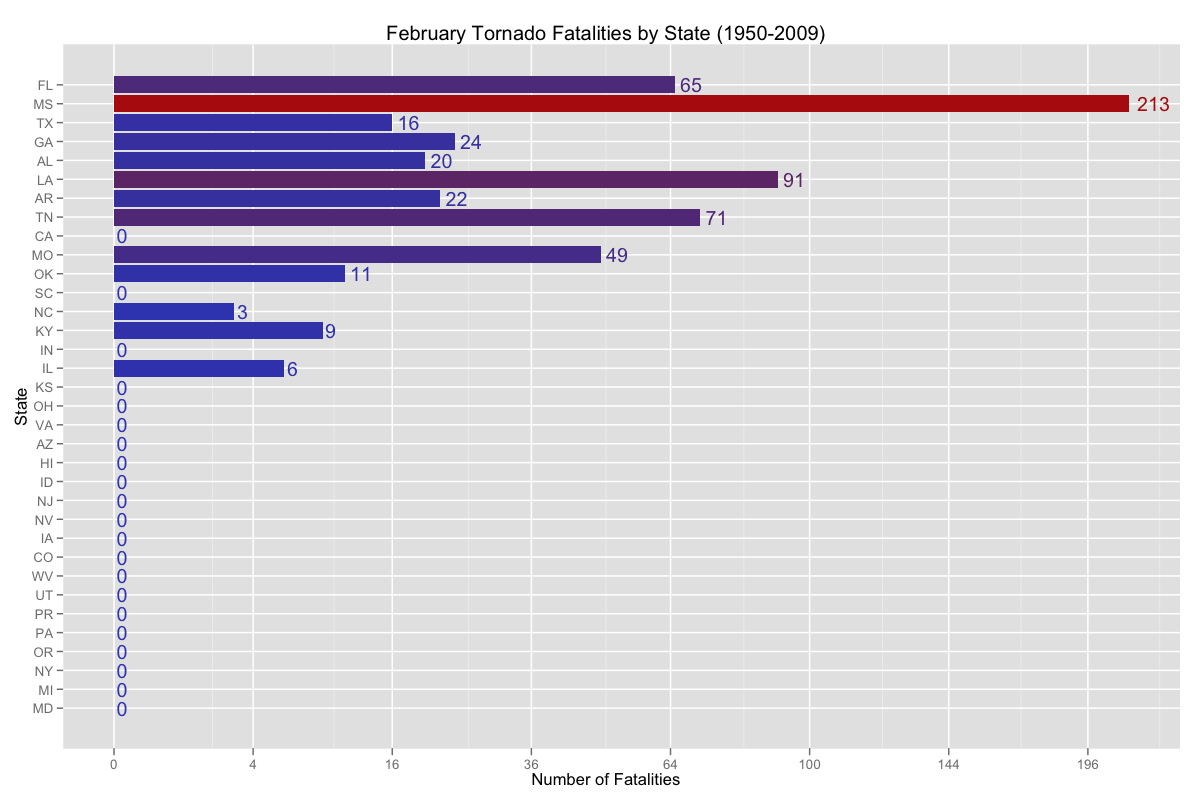
The number of fatalities per state break down as follows (please note the order of the states listed on the left is in descending order of number of tornadoes per state):
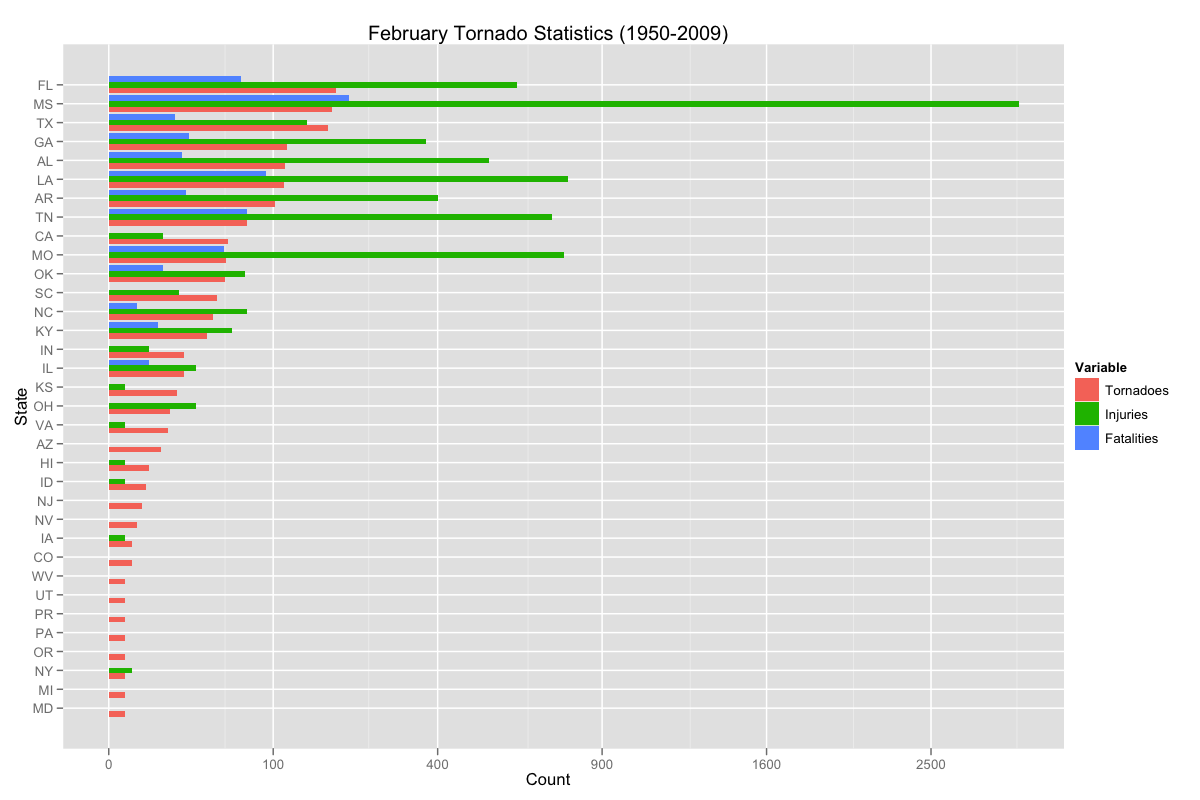
And putting everything into a single, cluttered figure, we have this:
