Tropical cyclones are giant, yet complex, heat engines driven by the release of latent heat. In a simplified context, here is how this heat engine works:
- Thunderstorms develop over the warm tropical waters in an area of weak vertical wind shear. This results in thunderstorm updrafts being nearly 100% vertical.
- As thunderstorms continue to develop, latent heat is released in the middle troposphere. As a result of this mid-tropospheric warming, updrafts become stronger.
- Because air is rising faster than it is being replaced at the surface, the pressure at the surface decreases and a surface low-pressure develops.
- As a consequence of the developing surface low-pressure, thunderstorms begin to congeal and rotate around a central point. Additionally, air at the surface begins to converge into the center of the low-pressure.
- The increased surface convergence results in additional rising motion, meaning more thunderstorms, more latent heating, and further decrease in pressure.
Throughout all of this, the center of the tropical cyclone is located at the same horizontal location as a function of height. This is often referred to as a “vertically stacked cyclone”.
The processes described above continue until a balance is achieved, or something changes in the environment. Some negative environmental changes are cooler water temperatures (resulting in cooler, drier air being lifted), landfall, or an increase in shear. The reason an increase in shear is bad is because it tilts thunderstorm updrafts which acts to weaken the updrafts, in turn weakening the amount of latent heating.
The environment around Hurricane Irene has changed completely from a few days ago. Irene moved over land, is moving into cooler waters, and is experiencing an increase in vertical wind shear. How can I tell the latter? From utilizing the radial velocity from area Doppler radars.
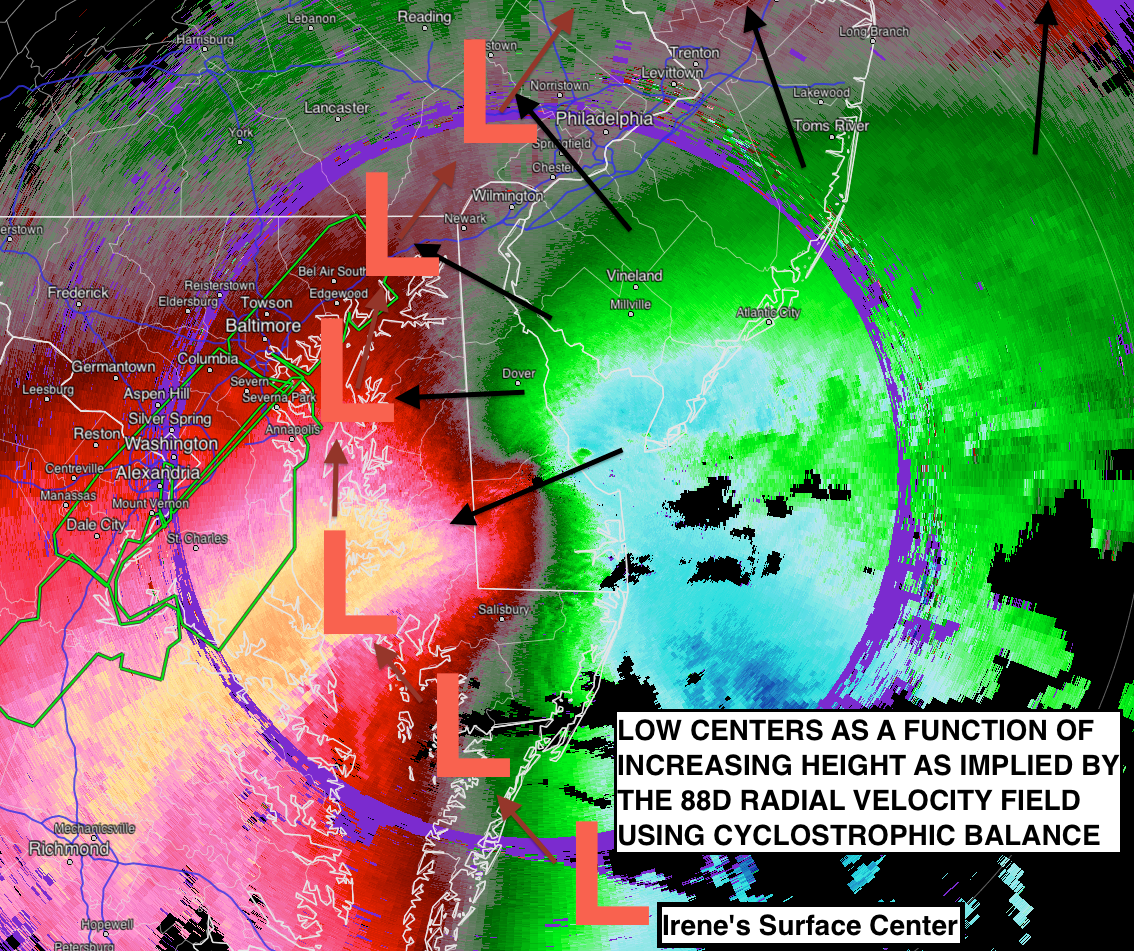
In a radial velocity image, the wind is either toward or away from a point (in this case the point is the Doppler radar). In the image below the doppler radar is the black dot in the center of the image. Pixels that are green to blue in color depict air that is moving directly toward the radar with green pixels indicating slower motion than blue. Pixels that are red to orange in color depict air that is moving directly away from the radar with red pixels indicating slower motion than orange. Pixels that are grey in color indicate air that has no component of motion toward the radar. This does not mean that the air is not moving!. It simply means that the air is not moving toward the radar. It might be moving very quickly, but is completely parallel perpendicular to the radar beam! Utilizing this fact, the giant grey “S” like shape down the middle of the image means that the wind is predominantly parallel perpendicular to the radar beam at that location. The black arrows indicate the wind direction along the grey “S” like shape.
One other fact to remember about radar interpretation is that because the earth is curved, the radar beam actually increases in height as it moves away from the radar itself. Thus in the image below, areas near the periphery of the image are at a higher altitude than areas near the center. Combining this fact with the wind directions from the black arrows, we can infer that the wind is changing direction from east-northeast at the surface to almost due south at some higher altitude.
Before I'm bombarded with complaints, I do not mean to imply that the center of Irene is located at each of the L's exactly. It is merely an approximation of where the center may be with increasing height based on the cyclostrophic balance. Other forces are at play, especially since the cyclone is transitioning from tropical to extra-tropical.
Now, let’s think back to the heat engine process described above. If the tropical cyclone is “vertically stacked”, and we assume the wind is cyclostrophic (meaning it is perfectly circular) about the center of the tropical cyclone (which is a good first order approximation), the wind would be in the same direction no matter what height we examined! If we looked at a radial velocity image, the grey “line” would be a straight! This is not the case with Irene. In fact, using the cyclostrophic balance, we can determine the approximate tilt with height of the center of Irene. This is denoted by the giant “L” on the image above. (The short arrows between “L” locations indicates the path from surface to higher altitudes.)
This tilt with height indicates that Irene will most likely not strengthen (at least not significantly) as it moves back over the ocean. Furthermore, this tilt with height probably indicates that Irene is undergoing a transition from a tropical cyclone to an extra-tropical cyclone. However, discussion of the differences in the types of cyclone and the transition process will be left to a future blog post.
