Playing with Data

Personal Views Expressed in Data

Historical Arkansas Tornadoes


UPDATED: 11:30 PM CDT on 25 April 2011
The statistics have been updated to better account for tornadoes that crossed state boundaries. This added 32 tornadoes and 9 fatalities to the Arkansas counts. None of these additional tornadoes were rated violent tornadoes (F/EF-4 or greater). The Arkansas Tornado CSV file has been updated as well.

Several large tornadoes moved through Arkansas this evening, with the worst damage as of this writing coming from the town of Vilonia, AR. Several television stations from Little Rock are now reporting that parts of Highway 64 “are missing”. Anytime reports of pavement being scoured, the talk inevitably turns to discussion about tornado ratings, and comparisons to other pavement scouring tornadoes. Personally, I believe any talk of ratings tonight is premature, however, I went ahead and pulled the Arkansas historical record to help put this event in perspective.

Officially, there has never been a F/EF-5 tornado in Arkansas. Let me repeat that. There has never been an F/EF-5 tornado in Arkansas. In fact, there have only been 26 F/EF-4 tornadoes. If this tornado is rated a violent tornado (EF-4 or EF-5), it will rank among the strongest 2% of all tornadoes to strike Arkansas. If we limit to only tornadoes between 1980 and 2010, only 1.3% of al tornadoes were “violent” tornadoes. Even though most tornadoes are not violent tornadoes, almost half of all tornado fatalities in Arkansas (53) resulted from these 13 EF-4 tornadoes. The fact that there have been so few reported fatalities as of this writing (only 1), is a testament to the National Weather Service in Little Rock and their excellent warnings.

Arkansas Tornadoes and Fatalities (1981 – 2010)

  • F/EF0 : 363 (36.37%)........0 fatalities (0.00%)
  • F/EF1 : 376 (37.68%)........1 fatalities (0.76%)
  • F/EF2 : 172 (17.23%).......24 fatalities (18.18%)
  • F/EF3 : 74 (7.41%).........54 fatalities (40.91%)
  • F/EF4 : 13 (1.30%).........53 fatalities (40.15%)
  • F/EF5 : 0 (0.00%)...........0 fatalities (0.0%)

Total : 998 tornadoes and 132 fatalities

In terms of all Arkansas tornadoes:

All Arkansas Tornadoes (1950 – 2010)

  • F/EF Unknown : 16 (1.01%)
  • F/EF0 : 436 (27.47%)
  • F/EF1 : 568 (35.79%)
  • F/EF2 : 387 (24.39%)
  • F/EF3 : 154 (9.70%)
  • F/EF4 : 26 (1.64%)
  • F/EF5 : 0 (0.00%)

Total: 1587 tornadoes

Here are all Arkansas F/EF-4 tornadoes:

All Arkansas F/EF-4 Tornadoes (1950 – 2010)

  • 21 March 1952 @ 14:40 (2:40 PM)
  • 21 March 1952 @ 16:50 (4:50 PM)
  • 21 March 1952 @ 17:00 (5:00 PM)
  • 21 March 1952 @ 17:30 (5:30 PM)
  • 21 March 1952 @ 18:00 (6:00 PM)
  • 19 December 1957 @ 12:44 (12:44 PM)
  • 10 April 1965 @ 18:26 (6:26 PM)
  • 03 April 1968 @ 18:30 (6:20 PM)
  • 19 April 1968 @ 15:12 (3:12 PM)
  • 15 May 1968 @ 20:36 (8:36 PM)
  • 15 May 1968 @ 20:45 (8:45 PM)
  • 26 May 1973 @ 22:30 (10:30 PM)
  • 28 March 1975 @ 19:52 (7:52 PM)
  • 02 April 1982 @ 17:20 (5:20 PM)
  • 24 December 1982 @ 17:00 (5:00 PM)
  • 15 March 1984 @ 17:40 (5:40 PM)
  • 15 March 1984 @ 19:17 (7:17 PM)
  • 14 April 1996 @ 18:10 (6:10 PM)
  • 01 March 1997 @ 14:20 (2:20 PM)
  • 01 March 1997 @ 14:47 (2:47 PM)
  • 01 March 1997 @ 15:25 (3:25 PM)
  • 01 March 1997 @ 15:41 (3:41 PM)
  • 01 March 1997 @ 18:20 (6:20 PM)
  • 16 April 1998 @ 1:50 (1:50 AM)
  • 21 January 1999 @ 17:50 (5:50 PM)
  • 05 February 2008 @ 16:49 (4:49 PM)

Keeping Perspective – Preliminary vs. Final Tornado Reports

Over the last few days, the southern United States has endured a significant severe weather event that took the lives of a still increasing number of people. While many communities are still trying to sift through the wreckage, meteorologists, “meteorologists”, chasers, and other weather enthusiasts have taken to Facebook and Twitter to discuss what has happened. Unfortunately, a lot of misinformation is floating around. Here’s my quick attempt to clarify some of this information.

As of this writing, 248 preliminary tornadoes have been reported via the Storm Prediction Center’s Preliminary Storm Report webpage over the three days 14-16 April 2011. Much has been made about this number. Unfortunately this number contains many duplicate tornadoes, and potentially even some tornadoes that never were. Hence the label “Preliminary”. Over the next few weeks, National Weather Service Offices throughout the south will be conducting damage surveys to determine the number of actual tornadoes to the best of their ability. There is no doubt that this has been a significant three-day tornado outbreak. However, until the official numbers are released via the National Weather Service’s Storm Data publication, people should exercise extreme caution in trying to quantify where this week’s severe weather outbreak ranks in history.

It used to be the case that the preliminary number of tornadoes underestimated the number of actual tornadoes. However, near March of 2006 the pattern reversed itself with the number of preliminary tornadoes typically overestimating the number of actual tornadoes. For more information regarding preliminary vs. final tornado reports, please read this blog post on the topic by Harold Brooks, which can be found on the United States Severe Weather Blog.

In 2008, the final tornado count was roughly 75-80% of the preliminary count. Based on the number of spotters now reporting tornadoes, it’s not out of the question to assume this ratio is now closer to 70%, if not lower. Based on this an estimated guess to the number of final tornadoes might be closer to 198 (80%), 186 (75%), or even 173 (70%). Since I know people want to know below are the top three-day tornado counts on record using the final tornado numbers. The date given is the last day of the three days used in the count.

Three Day** Final Tornado Counts (1950 – 2010)

  • 20040530: 184
  • 20030506: 183
  • 20040531: 172
  • 19740403: 166
  • 19920617: 152
  • 20030508: 148
  • 19740404: 147
  • 20070506: 136
  • 20070505: 135
  • 20030510: 135

** The day listed is the end of the three days used in the counting.

Update 1PM CDT 18 April 2011:
It should be noted that the 75% ratio mentioned above was computed prior to the SPC removing a simple time and space filter. As such, the current ratio will most likely be even lower.

SPC Day 3 Moderates in Context

UPDATES

(28 April 2013): Updated to add 16/17 April 2013 outlooks. Also added verification for all days.
(15 April 2013): Updated to account for today’s Day 3 Moderate Risk
(12 April 2012): Updated to account for today’s Day 3 Moderate Risk
(25 April 2011): Updated to account for today’s issuance of a Day 3 Moderate Risk

This morning, weather enthusiasts woke to a Storm Prediction Center (SPC) Day 3 Moderate Risk outlook for severe thunderstorms. Most weather enthusiasts already know a Day 3 Moderate Risk outlook is a pretty rare occurrence, but just how rare is it? The simple and misleading answer is that since 2000, and including today’s, only 10 11 Day 3 Moderate Risk outlooks have been issued. The more precise answer is a bit more complex.

The SPC is continually refining their products based on the state of the science and user feedback. As such the criteria for a Day 3 Moderate Risk outlook has changed over time. Currently, it takes an “Any Severe” probability of 45% and a “Significant Severe” probability of 10% to reach Day 3 Moderate Risk category. Previously it was possible to ascertain the Day 3 Moderate Risk with as little as an “Any Severe” probability as low as 30%, which has happened several more times since the change in probability criteria. Therefore, it is difficult to compare old Day 3 Moderate Risks to current Day 3 Moderate Risks. However, I’ve attempted to break them down below.

Below is a table of the date of issuance for Day 3 Moderate Risk outlooks:

Drought and Tornadoes in 2006

As many already know, the southern plains is in the midst of a fairly pronounced drought. The drought reminds me of the drought we experienced in Norman during 2005-2006. During the drought, the rain stopped in late summer of 2005 and remained that way through November of 2006, when a very intense cyclone helped to alter the prevailing storm track.

As we head into the spring storm season, I’ve been getting asked more and more frequently how the lack of precipitation in the southern plains will affect storm season. The answer to this question is highly complex, and poorly understood at this time. However, I’ll offer one possible outcome.

The lack of southern plains precipitation, and more importantly, the dry soil, might allow the dryline to mix eastward faster than if the soil held more moisture. This, coupled with warm air aloft being advected over the southern plains from the higher elevations of New Mexico (which has also been extremely hot and dry of late), will help suppress thunderstorm and tornado development across much of western Oklahoma and the Texas Panhandle.

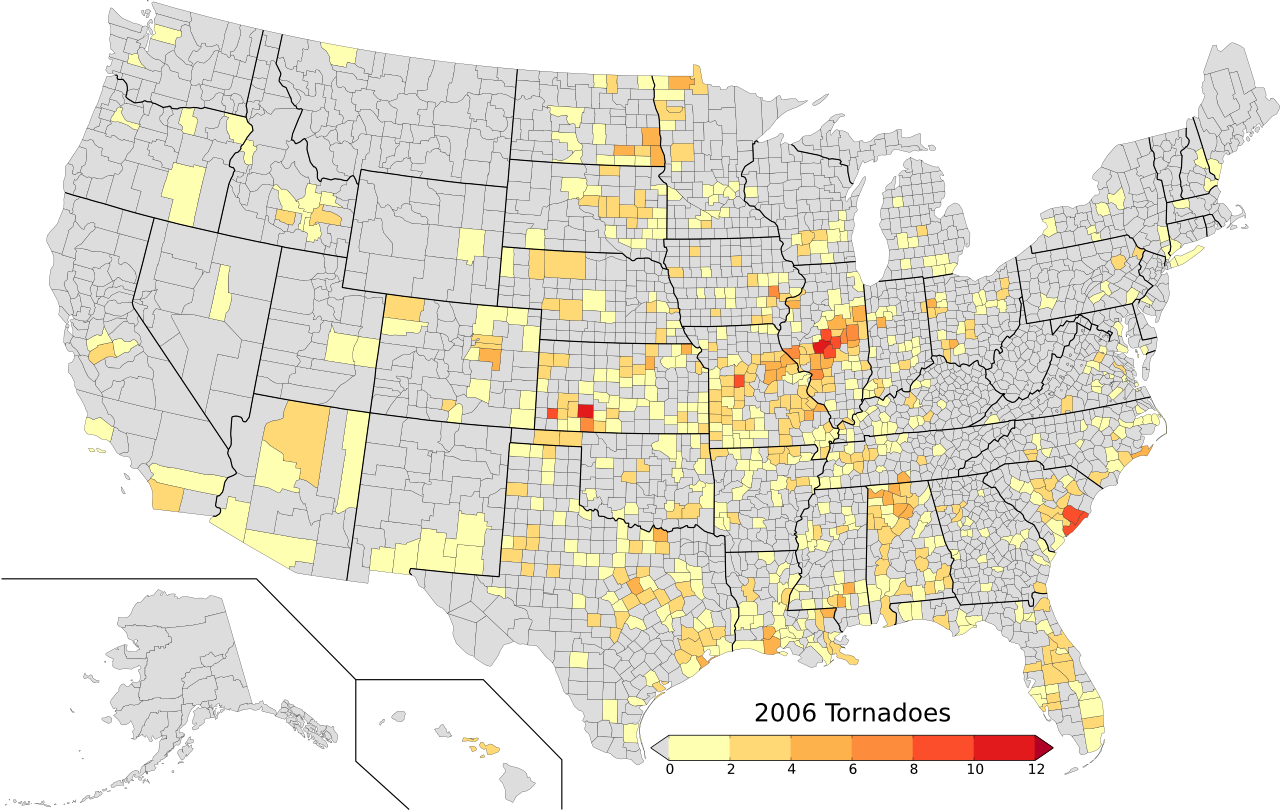
This is what happened in 2006, and you can see based on the graphic below, most of the tornadoes were to the north and east of western OK.

April Tornadoes

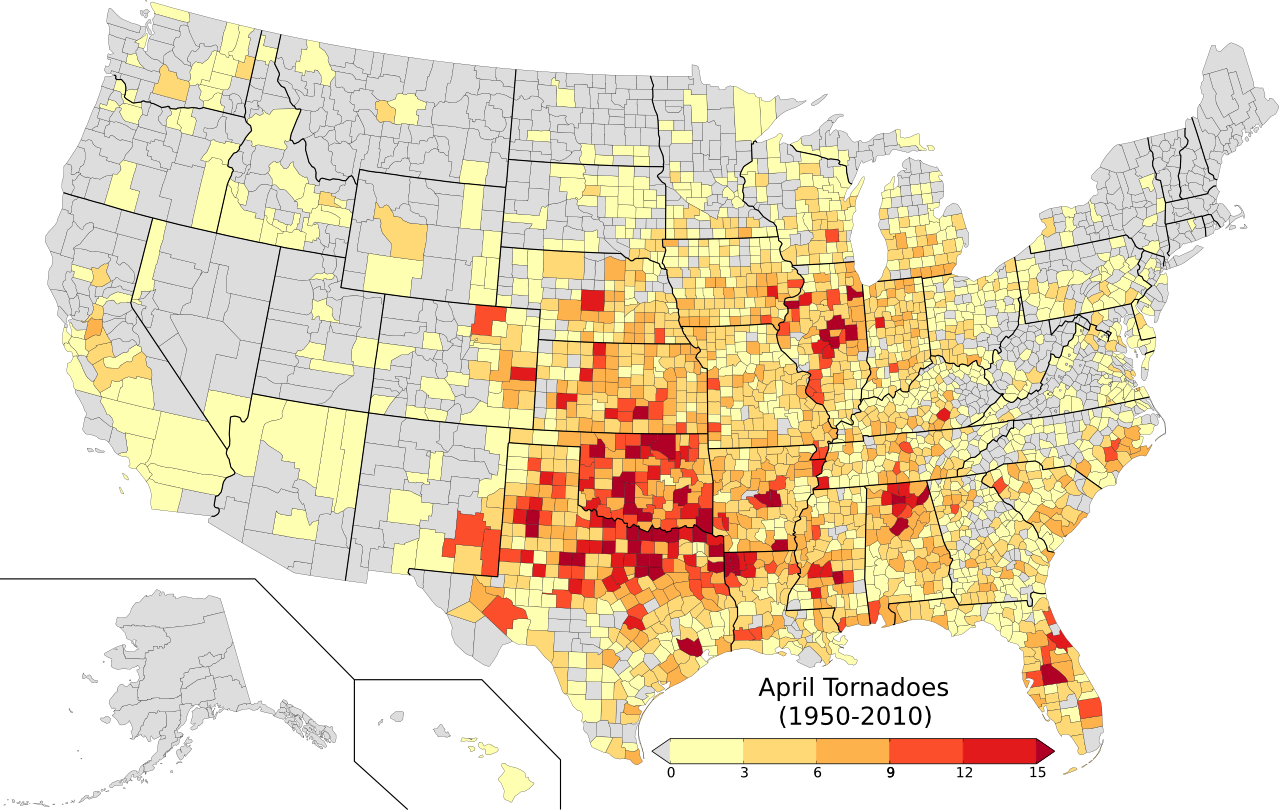
As we head into April, it’s time to update the plot of tornadoes by county for the current month. These data have been updated to include tornadoes in 2010. (Please note the modified color scale compared to January, February, and March.)

As you can see, the southern plains is becoming more as we approach late spring!