Playing with Data

Personal Views Expressed in Data

AOTW: January Tornadoes

I apologize that this week’s answer is a day late. I was traveling yesterday and unable to access the Internet. But without further adieu, here is this week’s answer.

  • Since 1950, how many (official) tornadoes have occurred in January?

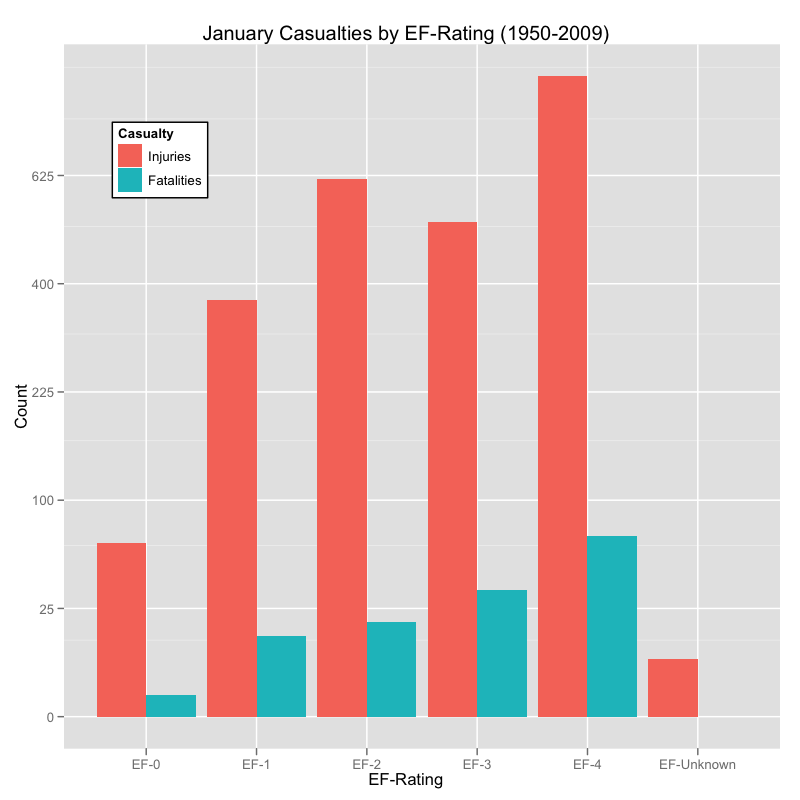
    • There have been 1193 tornadoes during the month of January in the 60 years spanning 1950 to 2009. This equates to an average of 19.88 tornadoes per year in January. Broken down by rating:
    • F/EF-Unknown: 30
    • F/EF-0: 391
    • F/EF-1: 443
    • F/EF-2: 251
    • F/EF-3: 67
    • F/EF-4: 11
    • F/EF-5: 0

As you can see, 1999 was a very active year in terms of January tornadoes. There were several tornado outbreaks that January, including the largest January outbreak on record, which affected parts of Arkansas, Tennessee, Mississippi, and Louisiana.

Experimental 4km NSSL-WRF Precipitation Type Graphics

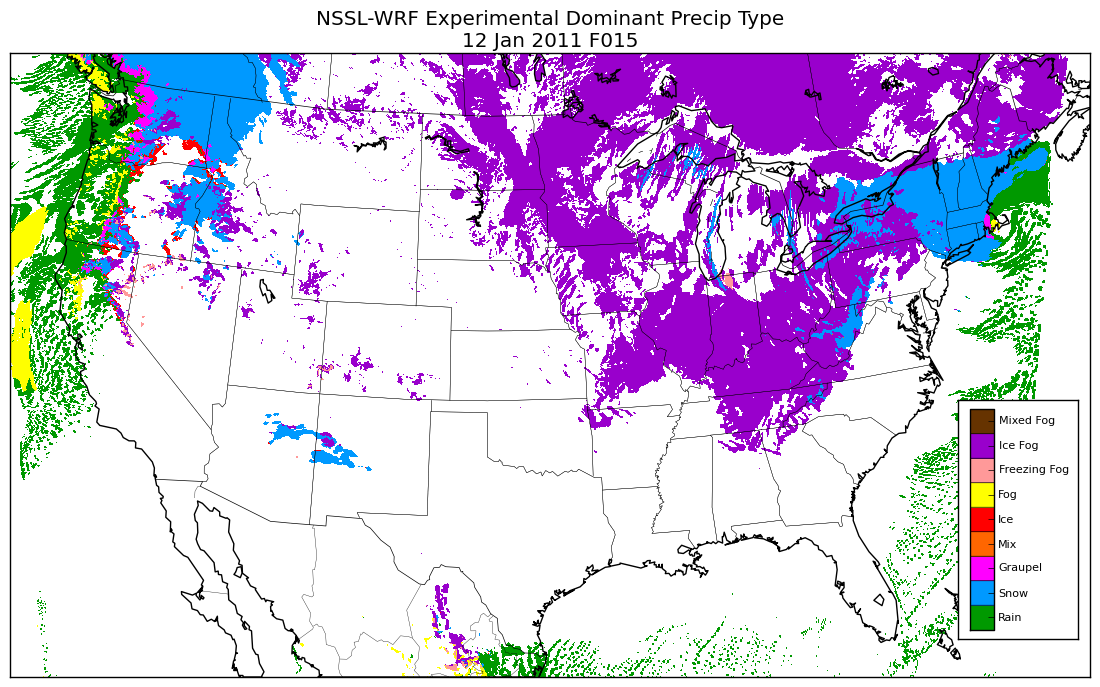
Back in December I started experimenting with producing precipitation type graphics from the 00 UTC initialization of a 4km WRF run daily at the National Severe Storms Laboratory (NSSL) based on suggestions from Jack Kain and Scott Dembek. The idea was to take the dominant hydrometeor from the lowest model level from the microphysics scheme (WSM6) and then assign a precipitation type. Currently I’m creating 9 different precipitation types based on the 5 different hydrometeor types from the model.

How these 9 precipitation types are calculated are given below:

  1. Rain: Rain water is the dominant hydrometeor type
  2. Snow: Snow is the dominant hydrometeor type
  3. Graupel: Grapuel is the dominant hydrometeor type
  4. Fog: Cloud water is the dominant hydrometeor type
  5. Ice Fog: Cloud ice is the dominant hydrometeor type
  6. Mix: Snow == Rain or Snow == Graupel or Rain == Graupel
  7. Ice: Rain water is the dominant hydrometeor type, and the temperature is at or below 273.15K
  8. Freezing Fog: Cloud water is the hydrometeor and the temperature is at or below 273.15K
  9. Mixed Fog: Fog == Ice Fog, Fog == Freezing Fog, or Ice Fog == Freezing Fog

This EXPERIMENTAL output is updated in the morning (not when the typical model output is available) and is currently linked on the main NSSL-WRF webpage on the left hand side (second of the products). A 36 hour loop is here.

I’d ask those who tend to look at weather maps on a daily basis to consider looking at this product and provide feedback on it. We know there are issues regarding the over-forecast of “ice fog” (and possibly even other fog), but are there other problems? Again, this is highly experimental and may not always be up to date. (The model initialization time will always be plotted on the image.) Any/all feedback is greatly appreciated.

QOTW: January Tornadoes

No long post tonight; just the “Question of the Week”.

Since 1950, how many (official) tornadoes have occurred in January? Leave your answers in the comments. I’ll post the answer on Friday.

Snow, Snow Everywhere, but Not a Flake for Me

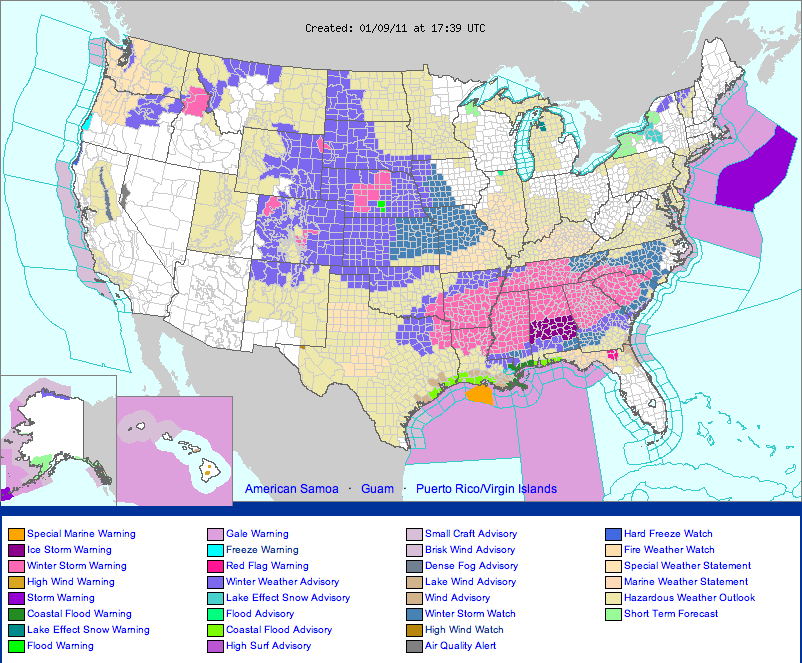
With apologies to Mr. Samuel Taylor Coleridge, the title above accurately captures my sentiment this morning. The 11:40 AM CST US Watch, Warning, and Advisory graphic above depicts two large regions of the country blanketed in winter weather headlines of various sorts.

"NWS Advisory-Watches-Warnings (09 January 2011 at 1739 UTC)"

In the southeast, Winter Storm Warnings have been hoisted in response to a strong short-wave trough and surface low pressure that are, and anticipated to, bring heavy snow to areas unaccustomed to such weather. Forecasts for southern Arkansas, northern Louisiana, central and northern Mississippi call for up to 8″ of snow in the next 24-36 hours. Furthermore, in portions of southern Arkansas, there is an outside chance for upwards of 12″!

In the plains, an assortment of winter weather headlines are in effect. This is in response to a developing cyclone that is anticipated to bring a fresh bout of cold air southward, but not nearly as cold as was previously advertised by the GFS model. Snow totals in the plains will range from a couple of inches in northern Oklahoma to upwards of a foot in portions of Nebraska.

So, as a winter weather aficionado, guess where I am? You probably guessed it. I’m located in the little swath of no winter weather headlines located along and just south of the Interstate 44 corridor in Oklahoma. So, central Oklahoma will miss out on the enjoyment of a fresh snowfall but experience the misery of several days of below normal conditions. Joy.

Smoke Plumes and Temperature Inversions

It’s been very dry across much of Oklahoma this winter. In fact, according to the Oklahoma Mesonet, in the last 30 days, Norman, OK has only received 0.13″ of rain. Over the last 60 or even 90 days the situation isn’t much better. Thus, it wasn’t much of a surprise this evening when I looked out my office window at the National Weather Center and saw the following:
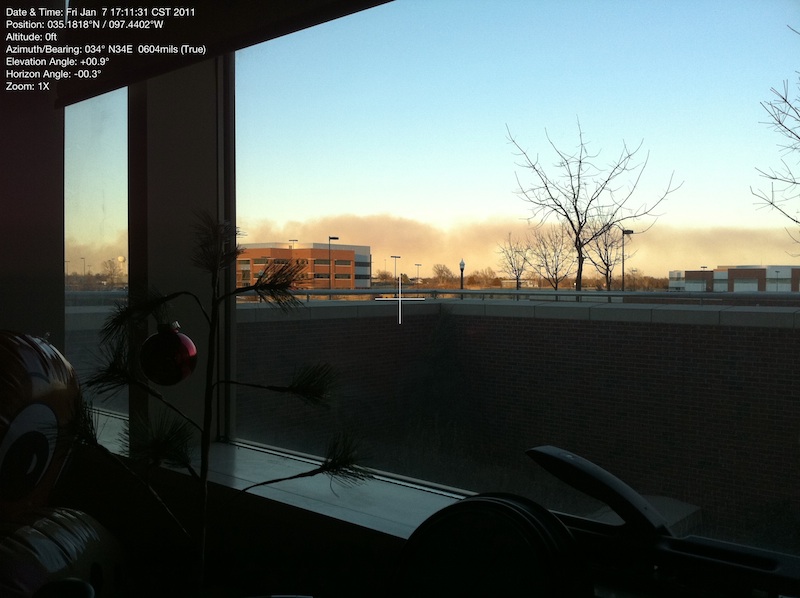
"Moore, OK Brush Fire (08 January 2011)"

Contrary to what a few people initially thought, this is not a pretty sunset highlighting a low stratus cloud. This is actually the smoke from what I initially thought was an out-of-control grass fire in extreme eastern Moore, OK. (Turns out this was apparently a controlled burn, which is surprising given the relatively high fire danger and other wildfires burning in the vicinity.)

Have you ever wondered why oftentimes smoke plumes tend to look like this? Namely, it initially rises and then appears to flatter out along some constant altitude? Turns out the answer lies in the vertical temperature structure of the atmosphere and to illustrate it, we’ll take a look at an atmospheric sounding from Norman, OK (taken approximately the time of this photograph) displayed on a Skew-T/Log-P Diagram, or Skew-T for short.
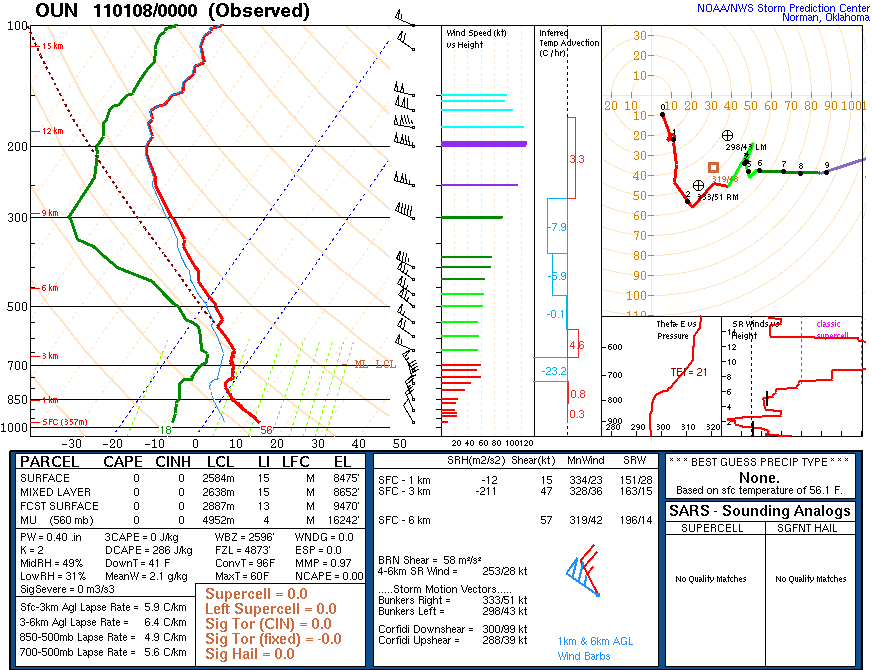
"OUN Sounding (08 January 2011 00 UTC)"

Above (and below) are tonight’s 00 UTC 08 January 2011 (6 PM CST 07 January 2011)) for Norman, OK. Even though the sounding is dated 00 UTC, it was actually launched approximately 45-60 minutes prior to 00 UTC. In this sounding, notice that the temperature decreases rapidly with height from the surface to around 800-millibars. In fact, it cools at around 10C over the first kilometer above the ground. This cooling rate is known as the dry adiabatic lapse rate. This is the rate of cooling expected if we were to lift any parcel of dry air vertically. Through the concepts of buoyancy and convective instability, any parcel that is warmer than ambient air will accelerate upward on it’s own, any parcel that is cooler than the ambient air will accelerate downward on it’s own, and any parcel the same temperature as the ambient air will continue to do whatever it is doing.

At around 800-millibars the temperature stops cooling as we increase height. In fact, it remains the same or even warms slightly! This warming with height is known as a temperature inversion, or inversion for short. I’ve circled this temperature inversion below.
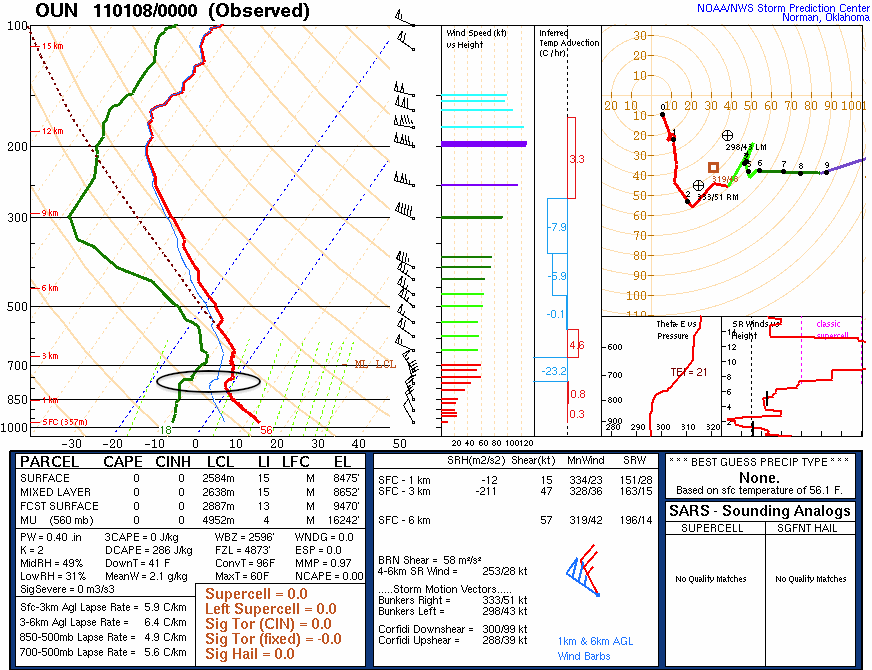
"Annotated OUN Sounding (08 January 2011 00 UTC)"

So what does this have to do with the smoke plume? Well, the smoke from the fire acts like a parcel of dry air. This means that for every one kilometer above the ground, the temperature of the smoke would be expected to cool 10C. (In reality the temperature of the smoke would most likely cool at a slightly faster rate due to processes such as turbulent mixing.) If we were to assume that the temperature of the smoke was approximately the same temperature as the ambient temperature, or slightly warmer, we would expect the smoke to accelerate upward. However, as the smoke accelerates upward it begins to cool, as we previously mentioned. It continues to rise because it is approximately the same temperature as the air surrounding it, so it will remain doing what it had been doing (which was rising).

Eventually the smoke will reach the height of the temperature inversion and become colder than the air surrounding it. At this point the smoke will begin to descend until it reaches an altitude where it is in equilibrium with the ambient air temperature, typically at or slightly below the height of the temperature inversion. At this point the smoke will begin to spread out horizontally instead of vertically, frequently being blow in a specific direction by the wind, as was the case yesterday evening.

So, by seeing smoke plumes spread horizontally, instead of vertically, one is actually visualizing the altitude of a temperature inversions.